

Genetic associations with obesity Quiz
 ShareCompartir
This website is archived for historical purposes and is no longer being maintained or updated.
Part I (Questions 1-4)
The first major GWAS discovery in obesity was reported by Frayling TM, et al. A common variant in the FTO gene is associated with body mass index and predisposes to childhood and adult obesity. Science 2007;316:889-94. The study compared 490,032 autosomal single-nucleotide polymorphisms (SNPs) in 1924 people with type 2 diabetes and 2938 population controls from the Wellcome Trust Case Control Consortium, a large research collaboration in the UK.
Please turn to the next page to see a copy of Figure 1 from this study.
NOTE: In panels A, B, and C of this Figure, each dot in represents a SNP. Line D indicates positions of the genes FTO and KIA1005 in a region of chromosome 16, which serves as the X-axis for all the panels.
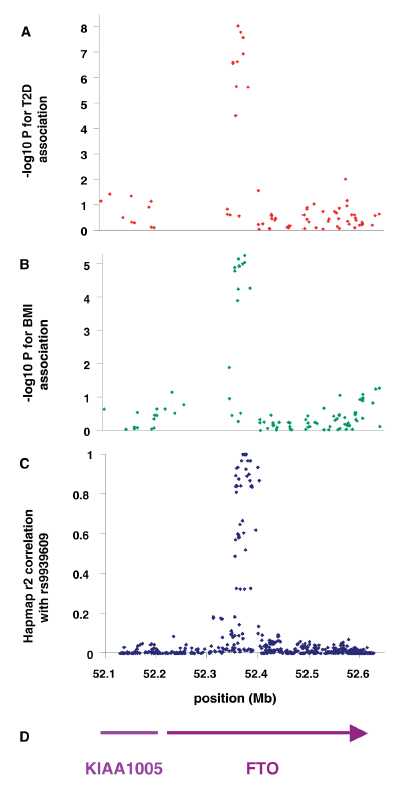
Figure 1: Association of SNPs in the FTO/KIA1005 region of chromosome 16 with (a) type 2 diabetes using 1924 cases and 2938 controls and (B) adults BMI in type 2 diabetic patients. (C) Linkage disequuilibrium (r2) between associated SNP rs9939609 and all other SNPs in HapMap data in Caucasian European samples. (D) Gene postitions.
Please consult the preceding Figure to answer Questions 1 and 2.
Question 1: What association is depicted in panel A of the Figure? What association is depicted in panel B? What is the most likely explanation for the less significant P-values in panel B? What do the combined findings in panels A and B suggest to you?

Question 2: In panels A and B, the Y-axis represents ‒log10 of the P-value for each association. What does the Y-axis in panel C represent? How would you interpret the pattern in panel C?
Question 3: In this study, SNP rs9939609 in the FTO gene region was strongly associated with type 2 diabetes, both in the original study population (OR = 1.27, 95% CI = 1.16 to 1.37, P = 5 x 10⁻⁸) and in a replication set of 3757 type 2 diabetes cases and 5346 controls (OR = 1.15, 95% CI = 1.09 to 1.23, P = 9 x 10⁻⁶). Analysis of the replication set was repeated with adjustment for body mass index (BMI) (OR = 1.03; 95% CI = 0.96 to 1.10; P = 0.44). How did adjusting for BMI affect the association of FTO rs9939609 with type 2 diabetes? What can you infer from this finding?
Question 4: Two GWAS replicated the FTO-obesity association within the first year of its discovery in 2007. Since then, more than 200 additional studies related to this association have been published, including 15 GWAS and 18 meta-analyses. In addition to replicating the original finding, what further research questions could these studies have been designed to answer? List three types of questions that could be explored in genetic association studies of FTO and obesity.
Part II (Questions 5-6)
Obesity is an important public health problem because it increases the risk of developing diabetes, heart disease, stroke, and other serious diseases. Many published studies have analyzed FTO genotype directly for association with these and other conditions. In another approach, FTO genotype has been used as an instrumental variable to examine the association of obesity with health outcomes.
Instrumental variables are used to evaluate causal relationships in epidemiology and other fields in which controlled experiments are not feasible. When the instrumental variable is a genotype, this approach is called “Mendelian randomization,” a term that refers to the random assignment of genotypes from parents to offspring. The population distribution of genotype is thus anticipated to be independent of other factors—measured or unmeasured—that could confound epidemiologic analysis of risk factor-disease associations. Furthermore, because genotype remains unchanged throughout life, its use as an instrumental variable offers protection against false inference due to reverse causation.
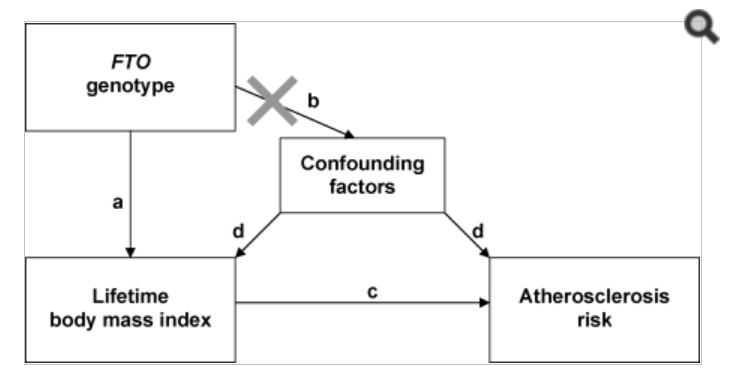
The diagram below is from an article by Kivimaki et al., Lifetime body mass index and later atherosclerosis risk in young adults: examining causal links using Mendelian randomization in the Cardiovascular Risk in Young Finns study. Eur Heart J 2008;2552-60. The “X” on path b indicates that FTO genotype is assumed to be independent of factors that could confound the association of lifetime body mass index with atherosclerosis.
Please consult this diagram to answer Questions 5-7.
Question 5: Which of the relationships in the diagram (a, b, c, d) must be established before designing the Mendelian randomization study? Why?
The Cardiovascular Risk in Young Finns study was a follow-up study, with repeated assessments in 1980 (participant age range 3–18 years), 1983 (6–21 years), 1986 (9–24 years), and 2001 (24–39 years). Height and weight were measured at each visit and used to calculate body mass index. The study investigators assessed the relationship in path a using two different measures of phenotype: adult body mass index (BMI = weight in kg/height2 in m) measured at age 24-39, and lifetime body mass index. The latter measure was calculated as a standardized z-score (mean = 0, standard deviation = 1) at each assessment; these z-scores were then averaged across assessments for each participant.
Table. Results for the linear regression of body mass index (BMI) on FTO genotype.
| mean (SD) by FTO genotype | |||||
|---|---|---|---|---|---|
| TT | AT | AA | change per A allele (95% CI) | P for trend | |
| Adult BMI | 24.9 (4.5) | 25.1 (4.3) | 25.4 (4.5) | 0.28 (0.02, 0.54) | 0.04 |
| Lifetime BMI | −0.07 (0.99) | 0.02 (1.01) | 0.11 (0.98) | 0.09 (0.03, 0.15) | 0.003 |
Question 6: Inspecting these results for effect size and statistical significance, what do you think of FTO genotype as a predictor of adult BMI? Of lifetime BMI? What implications does this have for the Mendelian randomization analysis?
Part III (Questions 7-9)
An explanation of the obesity epidemic has to consider both genetics and the environment. Numerous studies have analyzed gene-diet interactions in relation to obesity but for the most part, their findings have not been replicated. The first study to report replicating such findings in three independent populations was Corella, et al. APOA2, dietary fat and body mass index: replication of a gene-diet interaction in three independent populations. Arch Intern Med. 2009;169:1897–1906. This study found statistically significant interactions between the apolipoprotein A-II (APOA2) −265T>C variant and saturated fat intake in relation to obesity.
Data from Corella, et al., presents results from the Framingham Offspring Study. Saturated fat intake was categorized according to the mean observed in the study (22g/d) and obesity was defined as BMI>=30 kg/m2.
| Saturated fat |
APOA2 Genotype |
Obesity (n) | OR1 (95% CI) |
P | OR2 (95% CI) |
p | |
|---|---|---|---|---|---|---|---|
| No | Yes | ||||||
| <22g/d | TT+TC | 544 | 150 | 1 | 1 | ||
| CC | 111 | 24 | 0.811 (0.486-1.352) |
0.422 | 0.879 (0.523-1.478) |
0.627 | |
| >=22g/d | TT+TC | 393 | 135 | 1 | 1 | ||
| CC | 63 | 39 | 1.739 (1.081-2.798) |
0.023 | 1.761 (1.085-2.860) |
0.022 | |
Question 7: Note that the authors have laid out their results in a “2x4 table”—but they have calculated genotype-specific risks stratified by diet, rather than calculating ORg, ORe, and ORge relative to a single reference group. Because this was a cohort study, we can use prevalence to estimate the absolute risk of obesity in each genotype by diet stratum. Complete the table below. Use the calculator at http://statpages.org/confint.html to calculate confidence intervals for each group. Label the strata Roo, Rgo, Roe, and Rge to indicate levels of genotype and environmental risk.
| Saturated fat intake | APOA2 Genotype | Obese | Not obese | Prevalence (Risk) |
95% CI | Stratum |
|---|---|---|---|---|---|---|
| <22g/d | TC+TT | 150 | 544 | |||
| <22g/d | CC | 24 | 111 | |||
| >22g/d | TC+TT | 135 | 393 | |||
| >22g/d | CC | 39 | 63 | |||
| Total | 348 | 1111 | 0.238 | 0.217-0.261 |
Statistical interaction on the additive (risk difference) scale, Ird, is defined as follows:
Ird = Rge – Rgo – (Roe - Roo)
Note that when dealing with relative risks estimated by odds ratios rather than absolute risks,
ORoo = 1, producing the familiar formula ORge = ORg + ORe – 1.
Question 8: In the absence of interaction on the additive scale, what is the expected value of Ird? Use your data from Question 7 to calculate Ird. Is there evidence of interaction on the additive scale?
The expected value of Ird is zero in the absence of interaction.
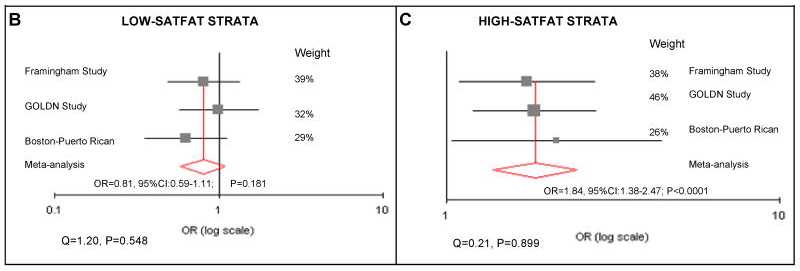
Corella, et al., replicated their findings on APOA2 and saturated fat intake from the Framingham Offspring Study in two additional populations: the Genetics of Lipid Lowering Drugs and Diet Network (GOLDN) study, and a study of Puerto Rican persons living in Boston. Results from a meta-analysis of all three studies are shown in panels B and C from Figure 4 in their article.
Question 9: One explanation that is often cited to explain the increasing population prevalence of obesity is that today’s environment is mismatched with "energy-thrifty genes" that multiplied in the distant past, when food sources were unpredictable. In other words, according to the "thrifty genotype" hypothesis, the same genes that helped our ancestors survive occasional famines by depositing fat during times of abundance are now being challenged by environments in which food is plentiful year round. From what has been presented here, speculate on the qualifications of APOA2 as a candidate “thrifty gene.” Do you think this concept is relevant to public health efforts to prevent obesity?
- Page last reviewed: November 15, 2013 (archived document)
- Content source: