
2009-2010 Influenza Season Week 19 ending May 15, 2010
All data are preliminary and may change as more reports are received.
Synopsis:
During week 19 ( May 9 - 15, 2010), influenza activity decreased in the U.S.
- 14 (0.9%) specimens tested by U.S. World Health Organization (WHO) and National Respiratory and Enteric Virus Surveillance System (NREVSS) collaborating laboratories and reported to CDC/Influenza Division were positive for influenza.
- All four subtyped influenza A viruses were 2009 influenza A (H1N1).
- The proportion of deaths attributed to pneumonia and influenza (P&I) was below the epidemic threshold.
- No influenza-associated pediatric deaths were reported.
- The proportion of outpatient visits for influenza-like illness (ILI) was 0.8%, which is below the national baseline of 2.3%. All 10 regions reported ILI below region-specific baseline levels.
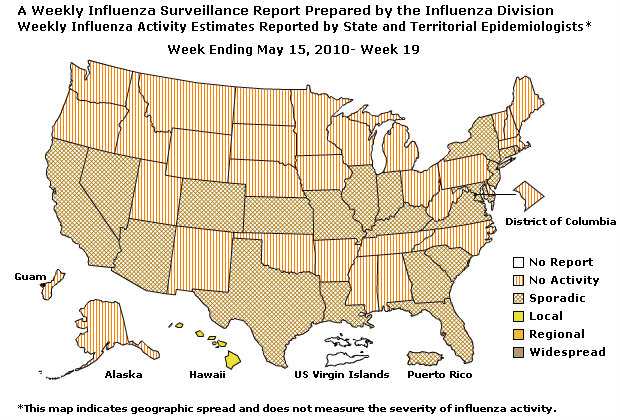
- No states reported widespread or regional influenza activity. One state reported local influenza activity. Puerto Rico and 19 states reported sporadic influenza activity. The District of Columbia, Guam, and 30 states reported no influenza activity, and the U.S. Virgin Islands did not report.
| HHS Surveillance Regions** | Data for current week | Data cumulative since August 30, 2009 (Week 35)* | ||||||||
|---|---|---|---|---|---|---|---|---|---|---|
| Out-patient ILI† | % positive for flu‡ | Number of jurisdictions reporting regional or widespread activity§ | A (H1) | A (H3) | 2009 A (H1N1) | A (unable to sub-type)¥ | A(Subtyping not performed) | B | Pediatric Deaths | |
| Nation | Normal | 0.9% | 0 of 54 | 34 | 70 | 66,848 | 287 | 22,612 | 355 | 273 |
| Region 1 | Normal | 2.1% | 0 of 6 | 4 | 5 | 3,419 | 14 | 503 | 12 | 6 |
| Region 2 | Normal | 0.5% | 0 of 4 | 8 | 7 | 1,824 | 0 | 2,409 | 14 | 19 |
| Region 3 | Normal | 0.3% | 0 of 6 | 3 | 13 | 10,724 | 48 | 1,453 | 18 | 15 |
| Region 4 | Normal | 2.1% | 0 of 8 | 0 | 8 | 9,901 | 94 | 4,744 | 94 | 52 |
| Region 5 | Normal | 0.7% | 0 of 6 | 8 | 25 | 9,518 | 46 | 1,584 | 22 | 36 |
| Region 6 | Normal | 0.8% | 0 of 5 | 2 | 3 | 5,210 | 19 | 5,570 | 100 | 73 |
| Region 7 | Normal | 0.7% | 0 of 4 | 3 | 2 | 3,306 | 3 | 849 | 9 | 8 |
| Region 8 | Normal | 1.0% | 0 of 6 | 4 | 2 | 9,889 | 0 | 3,948 | 56 | 16 |
| Region 9 | Normal | 1.3% | 0 of 5 | 0 | 4 | 8,364 | 49 | 1,204 | 24 | 38 |
| Region 10 | Normal | 0.0% | 0 of 4 | 2 | 1 | 4,693 | 14 | 348 | 6 | 10 |
*Influenza season officially begins each year at week 40. This season data from week 35 will be included to show the trend of influenza activity before the official start of the 2009-10 influenza season.
**HHS regions (Region 1 CT, ME, MA, NH, RI, VT; Region 2: NJ, NY, Puerto Rico, US Virgin Islands; Region 3: DE, DC, MD, PA, VA, WV; Region 4: AL, FL, GA, KY, MS, NC, SC, TN; Region 5: IL, IN, MI, MN, OH, WI; Region 6: AR, LA, NM, OK, TX; Region 7: IA, KS, MO, NE; Region 8: CO, MT, ND, SD, UT, WY; Region 9: AZ, CA, Guam, HI, NV; and Region 10: AK, ID, OR, WA).
† Elevated means the % of visits for ILI is at or above the national or region-specific baseline
‡ National data are for current week; regional data are for the most recent three weeks
§ Includes all 50 states, the District of Columbia, Guam, Puerto Rico, and U.S. Virgin Islands
¥ Subtyping results for the majority of specimens in this category were inconclusive because of low virus titers.
U.S. Virologic Surveillance:
WHO and NREVSS collaborating laboratories, located in all 50 states and Washington, D.C., report to CDC the number of respiratory specimens tested for influenza and the number positive by influenza type and subtype. The results of tests performed during the current week are summarized in the table below.
| Week 19 | |
|---|---|
| No. of specimens tested | 1,621 |
| No. of positive specimens (%) | 14 (0.9%) |
| Positive specimens by type/subtype | |
| Influenza A | 14 (100.0%) |
| A (2009 H1N1) | 4 (28.6%) |
| A (subtyping not performed) | 10 (71.4%) |
| A (unable to subtype) | 0 (0.0%) |
| A (H3) | 0 (0.0%) |
| A (H1) | 0 (0.0%) |
| Influenza B | 0 (0.0%) |
During week 19, no influenza B viruses were reported, and all four subtyped influenza A viruses were 2009 influenza A (H1N1.
View WHO-NREVSS Regional Bar Charts | View Chart Data | View Full Screen | View PowerPoint Presentation
Pneumonia and Influenza Hospitalization and Death Tracking:
The Aggregate Hospitalization and Death Reporting Activity (AHDRA) system was implemented on August 30, 2009, and replaced the weekly report of laboratory confirmed 2009 H1N1-related hospitalizations and deaths that began in April 2009. Jurisdictions report to CDC the number of hospitalizations and deaths resulting from all types or subtypes of influenza, not just those associated with 2009 H1N1. Counts were reset to zero on August 30, 2009. From August 30, 2009 – April 3, 2010, 41,914 laboratory-confirmed influenza-associated hospitalizations and 2,125 laboratory-confirmed influenza-associated deaths were reported to CDC.
Reporting of influenza-associated hospitalizations and deaths through AHDRA was discontinued during the week ending April 3, 2010 (week 13). CDC will continue to use its traditional influenza surveillance systems to track the remainder of the 2009-10 season.
View Full Screen | View Chart Data | View PowerPoint Presentation
Antigenic Characterization:
CDC has antigenically characterized two seasonal influenza A (H1N1), 14 influenza A (H3N2), 32 influenza B, and 1,832 2009 influenza A (H1N1) viruses collected since September 1, 2009.
Both seasonal influenza A (H1N1) viruses tested were related to the influenza A (H1N1) component of the 2009-10 Northern Hemisphere influenza vaccine (A/Brisbane/59/2007).
The 14 influenza A (H3N2) viruses tested showed reduced titers with antisera produced against A/Brisbane/10/2007, the 2009-2010 Northern Hemisphere influenza A (H3N2) vaccine component, and were antigenically related to A/Perth/16/2009, the WHO recommended influenza A (H3N2) component of the 2010 Southern Hemisphere and 2010-11 Northern Hemisphere vaccine formulations.
Influenza B viruses currently circulating globally can be divided into two distinct lineages represented by the B/Yamagata/16/88 and B/Victoria/02/87 viruses. The influenza B component of the 2009-10 and 2010-11 Northern Hemisphere vaccines belongs to the B/Victoria lineage, which currently predominates in most countries where circulation of influenza B has been reported. Twenty-seven (84.4%) of the 32 influenza B viruses from the U.S. tested belong to the B/Victoria lineage and are related to the influenza vaccine component for the 2009-10 and 2010-11 Northern Hemisphere influenza B vaccine strain (B/Brisbane/60/2008). Five (15.6%) viruses tested belong to the B/Yamagata lineage.
One thousand eight-hundred twenty-six (99.7%) of 1,832 2009 influenza A (H1N1) viruses tested are related to the A/California/07/2009 (H1N1) reference virus selected by WHO as the 2009 H1N1 vaccine virus, and as a component in the 2010-11 Northern Hemisphere vaccine. Six viruses (0.3%) tested showed reduced titers with antiserum produced against A/California/07/2009.
Annual influenza vaccination is expected to provide the best protection against those virus strains that are related to the vaccine strains, but limited to no protection may be expected when the vaccine and circulating virus strains are so different as to be from different lineages. Antigenic characterization of 2009 influenza A (H1N1) viruses indicates that these viruses are only distantly related antigenically and genetically to seasonal influenza A (H1N1) viruses, suggesting that little to no protection would be expected from vaccination with seasonal influenza vaccine.
Composition of the 2010-11 Influenza Vaccine:
WHO has recommended vaccine strains for the 2010-11 Northern Hemisphere trivalent influenza vaccine, and FDA has made the same recommendations for the U.S. influenza vaccine. Both agencies recommend that the vaccine contain A/California/7/2009-like (2009 H1N1), A/Perth/16/2009-like (H3N2), and B/Brisbane/60/2008-like (B/Victoria lineage) viruses. A seasonal influenza A (H1N1) component is not included in the 2010-11 formulation, and the A (H3N2) component has been changed from the 2009-10 Northern Hemisphere vaccine formulation. This recommendation was based on surveillance data related to epidemiology and antigenic characteristics, serological responses to 2009-10 trivalent seasonal and 2009 H1N1 monovalent vaccines, and the availability of candidate strains and reagents.
Antiviral Resistance:
Since September 1, 2009, one seasonal influenza A (H1N1), 13 influenza A (H3N2), 23 influenza B, and 1,819 2009 influenza A (H1N1) virus isolates have been tested for resistance to the neuraminidase inhibitors (oseltamivir and zanamivir), and 2,914 2009 influenza A (H1N1) original clinical samples were tested for a single known mutation in the virus that confers oseltamivir resistance. In addition, one seasonal influenza A (H1N1), 14 influenza A (H3N2), and 1,830 2009 influenza A (H1N1) virus isolates have been tested for resistance to the adamantanes (amantadine and rimantadine). The results of antiviral resistance testing performed on these viruses are summarized in the table below. Additional laboratories perform antiviral testing and report their results to CDC, and positive results from that testing are included in the footnote.
Antiviral Resistance Testing Results on Samples Collected Since September 1, 2009.
| Samples tested (n) | Resistant Viruses, Number (%) | Samples tested (n) | Resistant Viruses, Number (%) | Samples tested (n) | Resistant Viruses, Number (%) | |
|---|---|---|---|---|---|---|
| Oseltamivir | Zanamivir | Adamantanes | ||||
| Seasonal Influenza A (H1N1) | 1 | 1 (100.0) | 0 | 0 (0) | 1 | 0 (0) |
| Influenza A (H3N2) | 13 | 0 (0) | 0 | 0 (0) | 14 | 14 (100.0) |
| Influenza B | 23 | 0 (0) | 0 | 0 (0) | N/A* | N/A* |
| 2009 Influenza A (H1N1) | 4,733 | 54†‡ (1.1) | 1,819 | 0 (0) | 1,830 | 1,826 (99.8) |
*The adamantanes (amantadine and rimantadine) are not effective against influenza B viruses.
†Two screening tools were used to determine oseltamivir resistance: sequence analysis of viral genes or a neuraminidase inhibition assay.
‡Additional laboratories perform antiviral resistance testing and report their results to CDC. Three additional oseltamivir resistant 2009 influenza A (H1N1) virus has been identified by these laboratories since September 1, 2009, bringing the total number to 57.
Nearly all 2009 influenza A (H1N1) viruses tested since April 2009 have been resistant to the adamantanes (amantadine and rimantadine).
Antiviral treatment with oseltamivir or zanamivir is recommended for all patients with confirmed or suspected influenza virus infection who are hospitalized or who are at higher risk for influenza complications. Additional information on antiviral recommendations for treatment and chemoprophylaxis of influenza virus infection is available at http://www.cdc.gov/h1n1flu/recommendations.htm.
2009 influenza A (H1N1) viruses were tested for oseltamivir resistance by a neuraminidase inhibition assay and/or detection of genetic sequence mutation, depending on the type of specimen tested. Original clinical samples were examined for a single known mutation in the virus that confers oseltamivir resistance in currently circulating seasonal influenza A (H1N1) viruses, while influenza virus isolates were tested using a neuraminidase inhibition assay that determines the presence or absence of neuraminidase inhibitor resistance, followed by neuraminidase gene sequence analysis of resistant viruses.
The majority of 2009 influenza A (H1N1) viruses are susceptible to the neuraminidase inhibitor antiviral medication oseltamivir; however, rare sporadic cases of oseltamivir resistant 2009 influenza A (H1N1) viruses have been detected worldwide. A total of 66 cases of oseltamivir resistant 2009 influenza A (H1N1) viruses have been identified in the United States since April 2009. One new case has been identified since last week. Fifty-seven of these specimens were collected after September 1, 2009. The proportion of oseltamivir-resistant 2009 H1N1 viruses does not represent the prevalence of oseltamivir-resistant 2009 H1N1 in the United States. Most cases were tested because drug resistance was suspected. All tested viruses retained their sensitivity to the neuraminidase inhibitor zanamivir. Of the 66 total cases identified since April 2009, 53 patients had documented exposure to oseltamivir through either treatment or chemoprophylaxis, three patients had no drug exposure but possible exposure to a person with oseltamivir resistant 2009 H1N1, six patients are under investigation to determine exposure to oseltamivir, three patients had neither documented oseltamivir exposure nor exposure to a person with oseltamivir resistant 2009 H1N1, and in one patient, exposure cannot be determined. Occasional development of oseltamivir resistance during treatment or prophylaxis is not unexpected. Enhanced surveillance, an increased availability of testing performed at CDC, and an increasing number of public health and other clinical laboratories performing antiviral resistance testing increase the number of cases of oseltamivir resistant 2009 influenza A (H1N1) viruses detected. All cases are investigated to assess the spread of resistant strains in the community.
To prevent the spread of antiviral resistant virus strains, CDC reminds clinicians and the public of the need to continue hand and cough hygiene measures for the duration of any symptoms of influenza, even while taking antiviral medications (http://www.cdc.gov/mmwr/preview/mmwrhtml/mm5832a3.htm).
Pneumonia and Influenza (P&I) Mortality Surveillance
During week 19, 7.1% of all deaths reported through the 122-Cities Mortality Reporting System were due to P&I. This percentage was below the epidemic threshold of 7.3% for week 19.
View Full Screen | View PowerPoint Presentation
Influenza-Associated Pediatric Mortality
No influenza-associated pediatric deaths were reported to CDC during week 19.
Since August 30, 2009, CDC has received 273 reports of influenza-associated pediatric deaths that occurred during the current influenza season (48 deaths in children less than 2 years old, 30 deaths in children 2-4 years old, 102 deaths in children 5-11 years old, and 93 deaths in children 12-17 years old). Two hundred twenty-two (81%) of the 273 deaths were due to 2009 influenza A (H1N1) virus infections, 50 were associated with an influenza A virus for which the subtype is undetermined, and one was associated with an influenza B virus infection. A total of 282 deaths in children associated with 2009 influenza A (H1N1) virus infection have been reported to CDC.
Among the 273 deaths in children, 148 children had specimens collected for bacterial culture from normally sterile sites and 51 (34.5%) of the 148 were positive; Streptococcus pneumoniae was identified in 11 (21.6%) of the 51 children, and Staphylococcus aureus was identified in 16 (31.4%) of the 51 children. Four S. aureus isolates were sensitive to methicillin, 11 were methicillin resistant, and one did not have sensitivity testing performed. Thirty-four (66.7%) of the 51 children with bacterial coinfections were 5 years of age or older, and 18 (35.3%) of the 51 children were 12 years of age or older.
Laboratory-Confirmed Influenza-Associated Pediatric Deaths by Date and Type/Subtype of Influenza.
| Date | 2009 H1N1 Influenza | Influenza A-Subtype Unknown | Seasonal Influenza | Total |
|---|---|---|---|---|
| Number of Deaths REPORTED for Current Week Week 19 (Week ending May 15, 2010) | 0 | 0 | 0 | 0 |
| Number of Deaths OCCURRED since August 30, 2009 | 222 | 50 | 1 | 273 |
| Number of Deaths OCCURRED since April 26, 2009 | 282 | 53 | 3 | 338 |
View Full Screen | View PowerPoint Presentation
Influenza-Associated Hospitalizations
Laboratory-confirmed influenza-associated hospitalizations are monitored using a population-based surveillance network that includes the 10 Emerging Infections Program (EIP) sites (CA, CO, CT, GA, MD, MN, NM, NY, OR and TN) and 6 new sites (IA, ID, MI, ND, OK and SD).
During September 1, 2009 – May 1, 2010, the following preliminary laboratory-confirmed overall influenza associated hospitalization rates were reported by EIP and the new sites (rates include influenza A, influenza B, and 2009 influenza A (H1N1)):
Rates [EIP (new sites)] for children aged 0-4 years and 5-17 years were 6.7 (10.9) and 2.5 (3.7) per 10,000, respectively. Rates [EIP (new sites)] for adults aged 18-49 years, 50-64 years, and ≥ 65 years were 2.5 (1.7), 3.2 (2.0) and 2.8 (1.8) per 10,000, respectively.
*The 2008-09 EIP rate ended as of April 14, 2009 due to the onset of the 2009 H1N1 season.
View Full Screen | View PowerPoint Presentation
Outpatient Illness Surveillance:
Nationwide during week 19, 0.8% of patient visits reported through the U.S. Outpatient Influenza-like Illness Surveillance Network (ILINet) were due to influenza-like illness (ILI). This percentage is below the national baseline of 2.3%.
View ILINet Regional Charts | View Chart Data | View Full Screen | View PowerPoint Presentation
On a regional level, the percentage of outpatient visits for ILI ranged from 0.3% to 1.5% during week 19. All 10 regions reported ILI below region-specific baseline levels. (Note: Use of the national baseline for regional ILI data or regional baselines for state-level data is not appropriate.)
Geographic Spread of Influenza as Assessed by State and Territorial Epidemiologists:
The influenza activity reported by state and territorial epidemiologists indicates geographic spread of both seasonal influenza and 2009 influenza A (H1N1) viruses and does not measure the severity of influenza activity.
- During week 19, the following influenza activity was reported:
- No states reported widespread influenza activity.
- No states reported regional influenza activity.
- Local influenza activity was reported by one state (Hawaii).
- Sporadic influenza activity was reported by Puerto Rico and 19 states (Arizona, California, Colorado, Connecticut, Florida, Georgia, Illinois, Indiana, Kansas, Kentucky, Louisiana, Maryland, Missouri, Nevada, New Jersey, New York, South Carolina, Texas, and Virginia).
- The District of Columbia, Guam, and 30 states (Alabama, Alaska, Arkansas, Delaware, Idaho, Iowa, Maine, Massachusetts, Michigan, Minnesota, Mississippi, Montana, Nebraska, New Hampshire, New Mexico, North Carolina, North Dakota, Ohio, Oklahoma, Oregon, Pennsylvania, Rhode Island, South Dakota, Tennessee, Utah, Vermont, Washington, Wisconsin, West Virginia, and Wyoming) reported no influenza activity.
- The U.S. Virgin Islands did not report.
--------------------------------------------------------------------------------
A description of surveillance methods is available at: http://www.cdc.gov/flu/weekly/fluactivity.htm
