

 ShareCompartir
Epi Info™ User Guide
Maps: Visual Representation of Data by Location
Base Layer
Base layers are available to enhance the map with additional information beyond of the project data. The previous section explained how to combine information from shapefiles, KML files, and the map server with a dataset to create choropleth and dot density maps. However, additional layers may be necessary to highlight points of interest or boundaries that are not evident in the data layers. You can add more layers to an existing map using the Add Base Layer option from the toolbar.
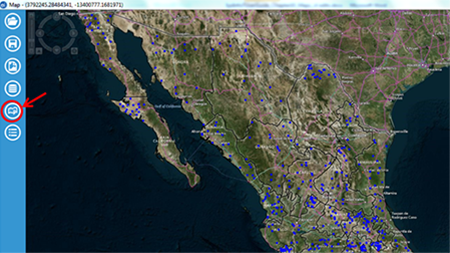
Figure 10.59: Add Base Layer in Epi Map toolbar
KML
The example below displays the storm track taken by Hurricane Katrina.
- From the toolbar at the left hand side of the Epi Map window, select Add Base Layer as shown in Figure 10.59. The Base Layer opens.
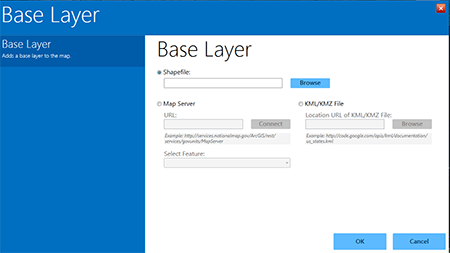
Figure 10.60: Add Base Layer
- Click the KML/KMZ File radio button to “light up” the option to enter or browse for a URL.
- Type the following URL for NOAA’s Katrina tracker:
http://ngs.woc.noaa.gov/storms/katrina/kml/katrina_track.kml
The map appears displaying Hurricane Katrina’s track.
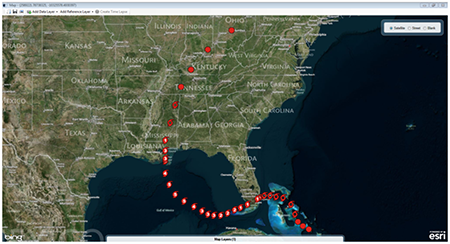
Figure 10.61: KML Reference Layer
Map Server
- From the toolbar at the left hand side of the Epi Map window, select Add Base Layer as shown in Figure 10.59. The Base Layer appears as shown in Figure 10.60.
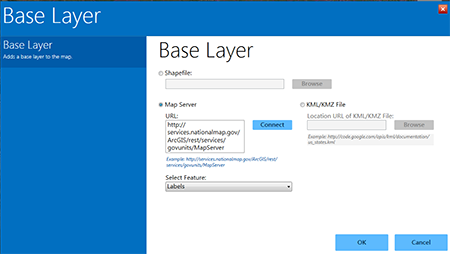
Figure 10.62: KML Reference Layer
- Click the Map Server radio button and enter a Map Server URL into the box. In this example, enter the sample URL shown below the blank URL box and here at USGS, The National Map (http://services.nationalmap.gov/ArcGIS/rest/services/govunits/MapServer).
- Select Labels from the Features drop-down menu.The map displays government units identified in the selected map server.
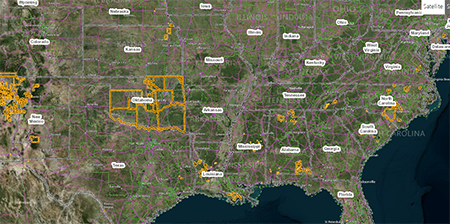
Figure 10.63: Map Server base layer
- Zooming in highlights additional layers of government units, with labels as selected in the Features drop-down.
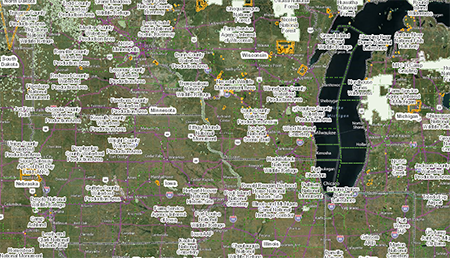
Figure 10.64: Server base layer zoomed view
Shapefiles
The example below displays the Mexican state boundaries from the Sample project folder.
- From the toolbar at the left hand side of the Epi Map window, select Add Base Layer as shown in Figure 10.59. The Base Layer appears as shown in Figure 10.60.
- Click the Shapefile radio button and click Browse to the right of the blank shapefile box.
- In the Sample.prj file, select the MXState.shp file.
- Click OK.
- The map will appear, displaying the shapefile boundaries (in this case, Mexican states).
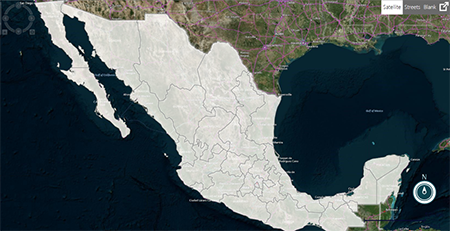
Figure 10.65: Shapefile Base Layer
- Page last reviewed: September 28, 2016
- Page last updated: September 28, 2016
- Content source: