The Epi Info™ Story
The Epi Info™ Story ~ 1990-1992 Versions 5 & 6, EpiMap, EpiTable & EpiNut
-
1990 - Version 5
Epi Info™, Version 5, featured a manual of 384 pages, that described missing value indicators, linear regression, a variety of graphs, analysis of matched data, a report generator, a relational file system, and features for nutritional anthropometry.
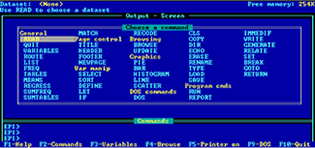
It allowed European date formats and non-English characters in data fields, and became the first version to be widely distributed internationally.
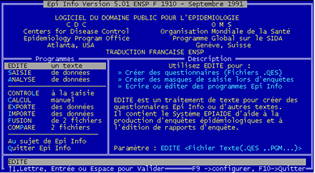
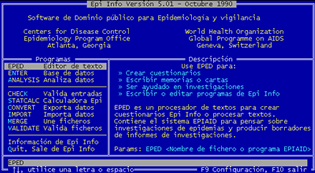
The Turbo Pascal source code was sent to volunteer translators who recompiled and distributed the programs in French, Spanish, and Chinese. An Arabic translation was done as a commercial venture, and the Russian version was done under contract to CDC.
-
1992 - Version 6
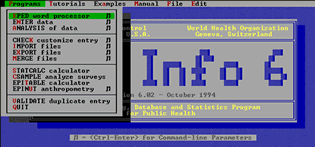
Epi Info™, Version 6, had a 600 page manual, many more programming features, improved graphics, exact statistics, extensive examples, a programmable menu system, and a mini reportable disease surveillance system for a state health department.
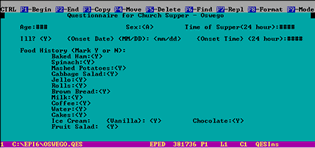
An Epi Info™, Version 6, questionnaire. Text defines the questions or prompts. Special symbols like ### and <Y> indicate numeric or Yes/No fields for data entry. Text fields are indicated by underline characters, but there are none in this questionnaire.

Robert Fagan, systems analyst at CDC, used Epi Info™ to develop reportable disease software eventually used in 42 states and territories in the US. 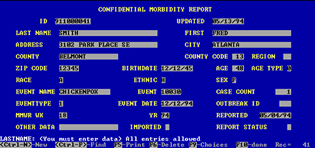
Analytic results from Version 6 of Epi Info™ include exact confidence limits for the odds ratio...
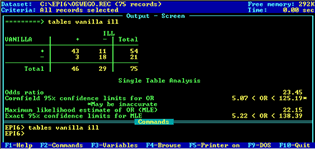
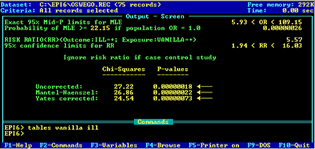
...and an explanation of the Risk Ratio, as well as the statistics from previous versions. The Fisher Exact test is not displayed here because none of the expected values of the cells is less than 5.
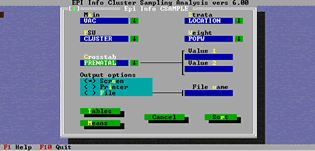
A new program in Version 6 processed data from complex sample designs, such as cluster samples used by WHO in immunization surveys, and stratified cluster samples frequently used in professionally designed surveys.
-
1992 - Epi Map, Version 1
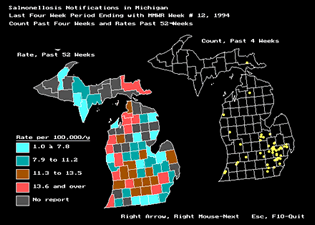
Epi Map, Version 1, was developed by Jeff Dean and Tony Burton in Geneva, with debugging and enhancements by Karl Brendel at CDC.
Version 2, developed at CDC, added features for programming what happens after mouse clicks on geographic areas.
-
1992 - EpiTable & EpiNut

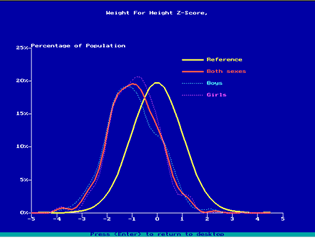
Dr. Denis Coulombier contributed two new programs, EpiTable and EpiNut, for statistical processing of tables and nutritional anthropometry, and many programming examples to Version 6. This version and several minor upgrades provided a solid basis for individual public health computing through the decade of the 90s and for worldwide distribution. Graphs of nutritional values of a population compared with an international reference population in Nutstat.
- Page last reviewed: September 12, 2016
- Page last updated: September 12, 2016
- Content source:


 ShareCompartir