

Prescription Painkiller Overdoses infographic
 ShareCompartir
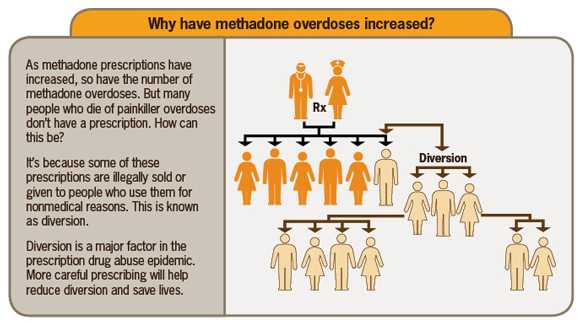
Why have methadone overdoses increased?
As methadone prescriptions have increased, so have the number of methadone overdoses. But many people who die of painkiller overdoses don’t have a prescription. How can this be?
It’s because some of these prescriptions are illegally sold or given to people who use them for nonmedical reasons. This is known as diversion.
Diversion is a major factor in the prescription drug abuse epidemic. More careful prescribing will help reduce diversion and save lives.
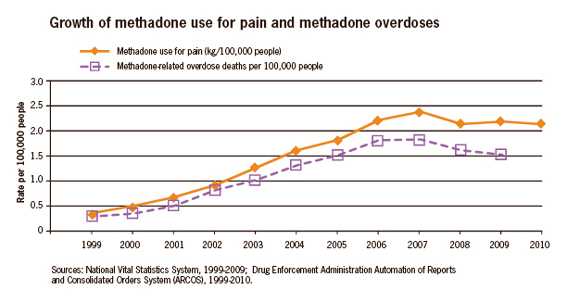
This line graph shows the growth in the use of methadone for pain compared to the rate of methadone overdoses per 100,000 people from 1999 to 2009 in the United States. The vertical axis shows the rate per 100,000 people. The horizontal axis shows the years. Methadone use for pain starts at 0.35 kilograms per 100,000 people in 1999, peaks at 2.40 in 2007, declines to 2.15 in 2008, and increases to 2.19 in 2009. Methadone-related overdoses increase from 0.28 per 100,000 people in 1999 to 1.83 in 2007, then decrease to 1.62 in 2008 and 1.53 in 2009. For more information, go to http://www.cdc.gov/mmwr.
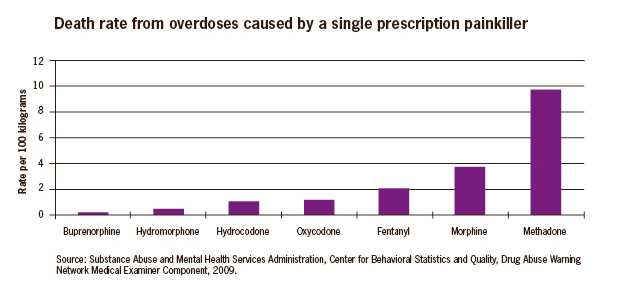
This bar chart shows the death rate per 100 kilograms from overdoses caused by a single prescription painkiller from a study done in 13 states in 2009. The vertical axis is the rate per 100 kilograms. The horizontal axis names the bar for each drug. The highest rate was for methadone. The death rates range from a low of 0.08 per 100 kilograms for buprenorphine to a high of 9.68 per 100 kilograms for methadone. For more information, go to http://www.cdc.gov/mmwr.
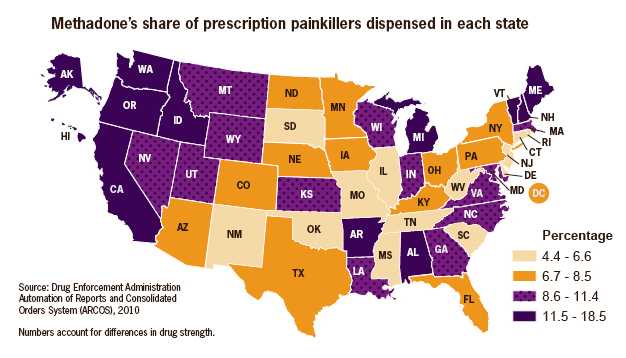
This color-coded U.S. map shows methadone's share of the painkillers distributed to each of the fifty states in 2010. The percentage from methadone ranges from 4.4 to 6.6 percent in the lowest quartile of states to 11.5 to 18.5 percent in the highest quartile of states. For more information, go to http://www.cdc.gov/mmwr.
- Page last reviewed: July 3, 2012
- Page last updated: July 3, 2012
- Content source:
- National Center for Injury Prevention and Control, Division of Unintentional Injury Prevention
- Page maintained by: Office of the Associate Director for Communications (OADC)