Tissue Doppler echocardiography
Tissue Doppler echocardiography (TDE) is a medical ultrasound technology, specifically a form of echocardiography that measures the velocity of the heart muscle (myocardium) through the phases of one or more heartbeats by the Doppler effect (frequency shift) of the reflected ultrasound. The technique is the same as for flow Doppler echocardiography measuring flow velocities. Tissue signals, however, have higher amplitude and lower velocities, and the signals are extracted by using different filter and gain settings. The terms tissue Doppler imaging (TDI) and tissue velocity imaging (TVI) are usually synonymous with TDE because echocardiography is the main use of tissue Doppler.
| Tissue Doppler echocardiography | |
|---|---|
| Medical diagnostics | |
| Purpose | measures the velocity of heart muscle |
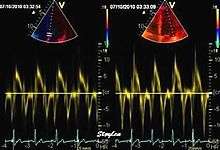
Like Doppler flow, tissue Doppler can be acquired both by spectral analysis (spectral density estimation) as pulsed Doppler[1] and by the autocorrelation technique as colour tissue Doppler[2] (duplex ultrasonography). While pulsed Doppler only acquires the velocity at one point at a time, colour Doppler can acquire simultaneous pixel velocity values across the whole imaging field. Pulsed Doppler on the other hand, is more robust against noise, as peak values are measured on top of the spectrum, and are unaffected of the presence of clutter (stationary reverberation noise).
Pulsed tissue Doppler echocardiography
This has become a major echocardiographic tool for assessment of both systolic and diastolic ventricular function. However, as this is a spectral technique, it is important to realise that measurement of peak values is dependent on the width of the spectrum, which again is a function of gain setting.
Clinical use
Pulsed wave spectral tissue Doppler has become a universal tool that is part of the general echocardiographic examination. Like any other echocardiographic measurement, measures by tissue Doppler should be interpreted in the context of the whole examination. The velocity curves are in general taken from the base of the mitral annulus at the insertion of the mitral leaflets, in the septal and lateral points of the four chamber view, and eventually the anterior and inferior points of the two-chamber views. For the right ventricle it is customary to use the lateral point of the tricuspid annulus only. Averaging peak velocities from the septal and lateral point has become common, although it has been shown that averaging all four points mentioned above, gives significantly less variability[3]
The method measures annular velocities to and from the probe during the heart cycle.
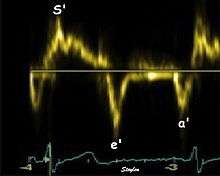
Annular velocities summarize the longitudinal contraction of the ventricle during systole, and elongation during diastole. Peak velocities are commonly used.
Systolic function
Peak systolic annular velocity (S') of the left ventricle is as close to a contractility measure as you can get by imaging[4] (bearing in mind that any imaging method only measures the result of fibre shortening, without measuring myocyte tension). S' has become a reliable measure of global function[5][6][7][8] It shares the advantage of annular displacement, that it is reduced also in hypertrophic hearts with small ventricles and normal ejection fraction (HFNEF), which is often seen in Hypertensive heart disease, Hypertrophic cardiomyopathy and Aortic stenosis.[9]
Likewise, peak ticuspid annular systolic velocity has become a measure of the right ventricular systolic function[10][11]
Diastolic function
As the ventricle relaxes, the annulus moves towards the base of the heart, signifying the volume expansion of the ventricle. The peak mitral annular velocity during early filling, e' is a measure of left ventricular diastolic function, and has been shown to be relatively independent of left ventricular filling pressure.[12][13][14][15] If there is impaired relaxation (Diastolic dysfunction), the e' velocity decreases. After the early relaxation, the ventricular myocardium is passive, the late velocity peak a' is a function of atrial contraction. The ratio between e' and a' is also a measure of diastolic function, in addition to the absolute values.
During the two filling phases, there is early (E) and late (A) blood flow from the atrium to the ventricle, corresponding to the annular velocity phases. The flow, is driven by the pressure difference between atrium and ventricle, this pressure difference is both a function of the pressure drop during early relaxation and the initial atrial pressure. In light diastolic dysfunction, the peak early mitral flow velocity E is reduced in proportion to the e', but if relaxation is so reduced that it causes increase in atrial pressure, E will increase again, while e', being less load dependent, remains low. Thus, the ratio E/e' is related to the atrial pressure, and can show increased filling pressure,[16][17][18] although with several reservations.[19][20] In the right ventricle this is not an important principle, as the right atrial pressure is the same as central venous pressure which can easily be assessed from venous congestion.[21][22]
.
Heart failure with preserved ejection fraction (HFPEF)
One of the main advantages of tissue Doppler is that diastolic and systolic function can be measured by the same tool. Before the advent of tissue Doppler, systolic function was usually assessed with ejection fraction (EF), and diastolic function by mitral flow. This led to the concept of pure "diastolic heart failure". However, In hypertrophic left ventricles with small cavity size, the systolic function is reduced although EF is not, as the EF is dependent on the relative wall thickness.[23] This has led to the concept of "pure diastolic heart failure" being discarded.[9] The preferred term is now heart failure with normal ejection fraction (HFNEF) or heart failure with preserved ejection fraction (HFPEF). This is common and is often seen in hypertensive heart disease, hypertrophic cardiomyopathy and aortic stenosis, and may comprise as much as 50% of the total heart failure population.[24] The prognosis of HFPEF is the same as for heart failure with dilated hearts.[25]
Normal values and physiology
Normal gender and age related reference values For both S', e' and a' have been established in the large HUNT study, comprising 1266 subjects free of heart disease, hypertension and diabetes.[26]
This study also shows that both S' and e' values decline with age, while a' increases (fig). There is also a significant correlation between S' and e', also in healthy subjects, showing the connection between systolic and diastolic function.
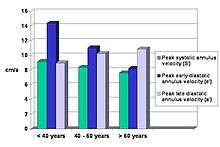
The e'/a' ratio becomes <1 about 60 years of age, which is similar to the E/A ratio of mitral flow. Women has slightly higher S' and e' velocities than men, although the difference disappears with age. The study also did show that velocities were highest in the lateral wall, and lowest in the septum. The E/e' was thus dependent on the site of e' measurement. The ratio was also age dependent.
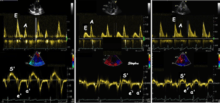
Colour tissue Doppler
Unlike spectral Doppler, colour tissue Doppler samples velocities from all points of the sector, by shooting two pulses successively, and calculating the velocity from the phase shift between them by autocorrelation. The calculation is slightly different from the true Doppler effect, but the result becomes identical. This results in a single velocity value per sample volume. The result is a velocity field of (nearly) simultaneous velocity vectors towards the probe. The advantage of colour Doppler over spectral Doppler is that all velocities can be sampled simultaneously. The disadvantage is that if there is clutter noise (stationary reverberations), the stationary echoes will be integrated in the velocity calculation, resulting in an under estimate. As pulsed wave Doppler are displayed as a spectrum, the colour Doppler values will correspond to the mean of the spectrum (in the absence of clutter), giving slightly lower values. In the HUNT study, the difference in peak systolic values were about 1.5 cm/s.[26]
The local velocities are not the result of the local function, as segments are moved by the action of neighbouring segments. Thus the velocity differences velocity gradient are the main measure of regional contraction, and has become the most important employment of colour tissue Doppler, in the method of strain rate imaging.[27]
References
- Isaaz K, Thompson A, Ethevenot G, Cloez JL, Brembilla B, Pernot C. Doppler echocardiographic measurement of low velocity motion of the left ventricular posterior wall. Am J Cardiol. 1989 Jul 1;64(1):66-75.
- McDicken WN, Sutherland GR, Moran CM, Gordon LN. Colour Doppler velocity imaging of the myocardium. Ultrasound Med Biol. 1992;18(6-7):651-4.
- Thorstensen A, Dalen H, Amundsen BH, Aase SA, Stoylen A. Reproducibility in echocardiographic assessment of the left ventricular global and regional function, the HUNT study. Eur J Echocardiogr. 2010 Mar;11(2):149-56. Epub 2009 Dec 3
- Thorstensen A, Dalen H, Amundsen BH, Støylen A.Peak systolic velocity indices are more sensitive than end-systolic indices in detecting contraction changes assessed by echocardiography in young healthy humans. Eur J Echocardiogr. 2011 Dec;12(12):924-30. Epub 2011 Sep 22.
- Gulati VK, Katz WE, Follansbee WP, Gorcsan J 3rd. Mitral annular descent velocity by tissue Doppler echocardiography as an index of global left ventricular function. Am J Cardiol 1996 May 1;77(11):979-84
- Vinereanu D, Ionescu AA, Fraser AG. Assessment of left ventricular long axis contraction can detect early myocardial dysfunction in asymptomatic patients with severe aortic regurgitation. Heart. 2001 Jan;85(1):30-6
- Vinereanu D, Florescu N, Sculthorpe N, Tweddel AC, Stephens MR, Fraser AG. Differentiation between pathologic and physiologic left ventricular hypertrophy by tissue Doppler assessment of long-axis function in patients with hypertrophic cardiomyopathy or systemic hypertension and in athletes. Am J Cardiol. 2001 Jul 1;88(1):53-8
- Stoylen A, Skjaerpe T. Systolic long axis function of the left ventricle. Global and regional information. Scand Cardiovasc J. 2003 Sep;37(5):253-8
- Yip G, Wang M, Zhang Y, Fung JW, Ho PY, Sanderson JE. Left ventricular long axis function in diastolic heart failure is reduced in both diastole and systole: time for a redefinition?Heart. 2002 Feb;87(2):121-5
- Alam M, Wardell J, Andersson E, Samad BA, Nordlander R. Characteristics of mitral and tricuspid annular velocities determined by pulsed wave Doppler tissue imaging in healthy subjects. J Am Soc Echocardiogr. 1999 Aug;12(8):618-28.
- Meluzín J, Spinarová L, Bakala J, Toman J, Krejcí J, Hude P, Kára T, Soucek M. Pulsed Doppler tissue imaging of the velocity of tricuspid annular systolic motion; a new, rapid, and non-invasive method of evaluating right ventricular systolic function. Eur Heart J. 2001 Feb;22(4):340-8.
- Rodriguez L, Garcia M, Ares M, Griffin BP, Nakatani S, Thomas JD. Assessment of mitral annular dynamics during diastole by Doppler tissue imaging: comparison with mitral Doppler inflow in subjects without heart disease and in patients with left ventricular hypertrophy. Am Heart J. 1996 May;131(5):982-7
- Sohn DW, Chai IH, Lee DJ, Kim HC, Kim HS, Oh BH, Lee MM, Park YB, Choi YS, Seo JD, Lee YW, although not entirely
- Pelà G, Regolisti G, Coghi P, Cabassi A, Basile A, Cavatorta A, Manca C, Borghetti A. Effects of the reduction of preload on left and right ventricular myocardial velocities analyzed by Doppler tissue echocardiography in healthy subjects. Eur J Echocardiogr. 2004 Aug;5(4):262-71
- Assessment of mitral annulus velocity by Doppler tissue imaging in the evaluation of left ventricular diastolic function. J Am Coll Cardiol. 1997 Aug;30(2):474-80
- Nagueh SF, Middleton KJ, Kopelen HA, Zoghbi WA, Quinones MA. Doppler tissue imaging: a noninvasive technique for evaluation of left ventricular relaxation and estimation of filling pressures. J Am Coll Cardiol. 1997 Nov 15;30(6):1527-33
- Farias CA, Rodriguez L, Garcia MJ, Sun JP, Klein AL, Thomas JD. Assessment of diastolic function by tissue Doppler echocardiography: comparison with standard transmitral and pulmonary venous flow. J Am Soc Echocardiogr. 1999 Aug;12(8):609-17
- Ommen SR, Nishimura RA, Appleton CP, Miller FA, Oh JK, Redfield MM et al. Clinical utility of Doppler echocardiography and tissue Doppler imaging in the estimation of left ventricular filling pressures: a comparative simultaneous Doppler-catheterization study. Circulation 2000; 102:1788–94
- Mullens W, Borowski AG, Curtin RJ, Thomas JD, Tang WH. Tissue Doppler imaging in the estimation of intracardiac filling pressure in decompensated patients with advanced systolic heart failure. Circulation 2009;119:62-70
- Park JH, Marwick TH. Use and Limitations of E/e' to Assess Left Ventricular Filling Pressure by Echocardiography. J Cardiovasc Ultrasound. 2011 Dec;19(4):169-73.
- Skjaerpe T, Hatle L. Noninvasive estimation of systolic pressure in the right ventricle in patients with tricuspid regurgitation. Eur Heart J. 1986 Aug;7(8):704-10
- Ommen SR, Nishimura RA, Hurrell DG, Klarich KW.Assessment of right atrial pressure with 2-dimensional and Doppler echocardiography: a simultaneous catheterization and echocardiographic study. Mayo Clin Proc. 2000 Jan;75(1):24-9.
- Maciver DH. A new method for quantification of left ventricular systolic function using a corrected ejection fraction.Eur J Echocardiogr. 2011 Mar;12(3):228-34
- Hogg K, Swedberg K, McMurray J.Heart failure with preserved left ventricular systolic function; epidemiology, clinical characteristics, and prognosis. J Am Coll Cardiol. 2004 Feb 4;43(3):317-27.
- Muntwyler J, Abetel G, Gruner C, Follath F. One-year mortality among unselected outpatients with heart failure.Eur Heart J. 2002 Dec;23(23):1861-6
- Dalen H, Thorstensen A, Vatten LJ, Aase SA, Stoylen A. Reference Values and Distribution of Conventional Echocardiographic Doppler Measures and Longitudinal Tissue Doppler Velocities in a Population Free from Cardiovascular Disease. 2010 Sep 1;3(5):614-22. Epub 2010 Jun 25.
- Heimdal A, Stoylen A, Torp H, Skjaerpe T. Real-time strain rate imaging of the left ventricle by ultrasound. J Am Soc Echocardiogr 1998 Nov;11(11):1013-19
External links
Websites
Books
Sutherland; Hatle; Claus; D'hooge;Bijnens (2006) Doppler Myocardial Imaging. BSWK, Belgium. ISBN 978-90-810592-1-3
Marwick; Yu; Sun (2007) Myocardial Imaging: Tissue Doppler and Speckle Tracking. Wiley-Blackwell. ISBN 978-1-4051-6113-8