Strain rate imaging
Strain rate imaging is a method in echocardiography (medical ultrasound) for measuring regional or global deformation of the myocardium (heart muscle). The term "deformation" refers to the myocardium changing shape and dimensions during the cardiac cycle. If there is myocardial ischemia, or there has been a myocardial infarction, in part of the heart muscle, this part is weakened and shows reduced and altered systolic function. Also in regional asynchrony, as in bundle branch block, there is regional heterogeneity of systolic function. By strain rate imaging, the simultaneous function of different regions can be displayed and measured. The method was first based on colour tissue Doppler.[1] by using the longitudinal myocardial velocity gradient, already in use transmurally.[2] Later, the regional deformation has also been available by speckle tracking echocardiography,[3][4] both methods having some, but different methodological weaknesses. Both methods, however, will acquire the same data (measurements may differ somewhat, however, being method dependent), and also can be displayed by the same type of display.
| Strain rate imaging | |
|---|---|
| Medical diagnostics | |
| Purpose | measuring regional/global deformation of myocardium |
The point of deformation imaging, is that a passive segment in the myocardium for instance after an infarct, may move due to the action of an adjacent segment (tethering). Thus the displacement or velocity of a segment do not tell about the function of that segment. Deformation imaging, on the other hand, measures the differences" of motion and velocity within the segment, which is equivalent to the deformation.
Basic concepts
Strain means Deformation, and is defined as relative change in length. The Lagrangian formula εL = (L-L0)/L0 = ΔL/L0, where L0 is baseline length and L is the resulting length, defines strain in relation to the original length as a dimensionless measure, where shortening will be negative, and lengthening will be positive. It is usually expressed in percent. An alternative definition, Eulerian strain defines the strain in relation to the instantaneous length: εE = ΔL/L. For a change over time, the Lagrangian strain will be: εL = Σ ΔL/L0, and Eulerian Strain εE = Σ (ΔL/L). The term was first used by Mirsky and Parmley in describing regional differences in deformation between normal and ischemic myocardium[5]
Strain rate is the rate of deformation. In ultrasound it is usually measured from the velocity gradient SR = (v2 - v1)/L where v2and v1 are the myocardial velocities at two different points, and L is the instantaneous distance between them. This is thus equivalent to the velocity difference per length unit (the spatial derivative of velocity) and has the unit s−1. Strain is then integrated from strain rate. This method, however, yields the Eulerian strain rate and strain. It has become traditional to use the Velocity gradient, but in integrating strain rate it is converted to Lagrangian strain by the formula εL = eεE - 1.[6]
Strain in three dimensions: Basically, any object or body is three dimensional, and can be deformed in different directions simultaneously. Strain can be described as a tensor with three principal strains (εx, εy and εz in a Cartesian coordinate system), and six shear strains components. In the heart, it has been customary to describe the three principal strain components as longitudinal (in the direction of the long axis of the ventricles), circumferential (in the direction of the ventricular circumference), and transmural (the deformation across the wall. Transmural deformation has also been called "radial", but this is unfortunate as in ultrasound in general the term radial describes "in the direction of the ultrasound beam"). However, as the heart muscle is incompressible, the three principal strain must balance; ((εx+1)(εy+1)(εz+1) = 1).[7] As the ventricle contracts in systole, there is longitudinal shortening (negative strain), circumferential shortening (negative strain) and transmural (wall) thickening (positive strain). Due to this, and the fact that the left ventricle in normal conditions contract with a relatively invariant outer contour,[8][9] the longitudinal strain contains the main information, while transmural strain (wall thickening) is a function of wall shortening, wall thickness and chamber diameter, while circumferential shortening is mainly a function of wall thickening. It has been shown clinically that longitudinal strain rate and wall thickening are diagnostically equivalent.[10]
Methods
Strain rate imaging can be done by two principally different methods.
Tissue Doppler
The Tissue Doppler method is based on the colour Doppler, giving a velocity field with velocity vectors along the ultrasound beam over the whole sector. It measures the velocity gradient between two points along the ultrasound beam with a set distance.[1] It gives the same result as the velocity gradient.[6] This method has been validated experimentally in a mechanical model,[11] in an animal model,[12] and in patients against echocardiography,[13] coronary angiography [10] and MR [14][15] The method is limited to one direction; along the ultrasound beam, can thus mainly be used from the apical window, and for longitudinal strain and strain rate measurements only. It is sensitive to angle deviation between the velocity vector (direction of motion) and the ultrasound beam, and is sensitive to noise, especially clutter noise. It has a high temporal resolution, at the cost of a relatively low lateral spatial resolution.
Speckle tracking
Speckle tracking echocardiography is based on grey scale echocardiography (B-mode), and the fact that the reflected echo from the myocardium shows a speckle pattern that is a mixture of small scatters and interference patterns.The pattern being random, each region of the myocardium (called a "kernel"), has a unique speckle pattern, and that this speckle pattern is relatively stable, at least from one frame to next. By this, the movement of a kernel from one frame to the next, can be tracked by a "best match" search algorithm. The most commonly used is the "sum of absolute differences",[4] shown to be similarly accurate as Cross-correlation.[16][17] The method thus tracks a kernels motion from one frame to the next. From the frame rate, the velocity vector can be calculated, both in magnitude and direction. From this, a velocity field again can be generated over the whole sector, as with tissue Doppler, and strain rate can be derived, and then strain can be integrated. Alternatively strain can be measured directly from the change in distance between speckles.[18][19] (resulting in Lagrangian strain directly), and strain rate derived temporally (it then has to be converted to Eulerian strain rate). The speckle tracking methods varies with non-commercial and commercial systems. Speckle tracking has been shown to be comparable to tissue Doppler derived strain,[20] and has been validated against MR [15][19][21]
The method tracks independently of the beam directions, and can thus track in two dimensions. It is also said to be independent of the angle error inherent in the Doppler algorithm. However, as the radial resolution (along the beam) is far better than the lateral resolution which also decreases with depth, both the angle independence and the tracking ability across the sector is lower. Also, instead of angle independency, the resulting strain values are dependent on the ROI (Region Of Interest) size and shape. Finally, in order to achieve tracking quality, the values are in most commercial applications smoothed by a spline smoothing function along the ROI, so the regional measurements are not pure regional, but rather to a degree, spline functions of the global average. In addition, the method has a lower sampling rate due to the limited frame rate of B-mode, which reduces tracking validity, especially at high heart rates.
Display
Both methods measures the same physiological phenomena (deformation), and results can in principle be displayed the same way.
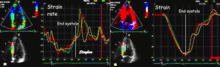
Curves
The most common way is by displaying curves of the strain and strain rate, typically the time course during one heart cycle. Each curve will then represent the deformation in one region of the myocardium, but acquisition of a full sector allows display of multiple curves simultaneously in the same image for comparison.
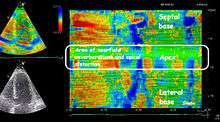
Colour display
Strain and strain rate values can be reduced to colour coded images, where strain or strain rate are shown as colours in semi-quantitative parametric imaging. This makes the method more robust, but numerical values are not available. On the other hand, this may result in a better spatial resolution. The displays most commonly used, are Bull's eye (reconstructed from multiple apical planes), which displays all parts of the left ventricle simultaneously, but only at one point in time. This is useful for either mid systolic strain rate or end systolic strain. Inhomogeneous strain rate or strain, representing regions with reduced contractility are often very evident visually.
Curved anatomical M-mode[22] from either one wall, or both walls simultaneously, gives a space-time diagram of the deformation, showing both spatial or temporal inhomogeneities in deformation. It is most useful when applied to strain rate, due to the rapid shifts in phase visible as seen by the figure. The strain rate values are reduced to semi quantitative visual display, but this mode allows measurement of timing, as well as depth, and is best suited to space-time relation measurement.
Clinical use
It is a major point that strain rate imaging is just a part of an integrated echocardiographic examination. Like all other measures, deformation measurements have limited accuracy, and should be considered together with the rest of findings. Also, a knowledge of the pitfalls and artefacts of the specific methods, is an advantage. However, the methods offer unique ways of imaging regional dysfunction, that may strengthen the conclusion.
Regional function
Normal values for strain and strain rate has been established by the HUNT study.[23]
Myocardial infarction
In myocardial infarction, a limited region of the heart muscle has reduced or totally absent function. It has been shown to be at least as accurate as B-mode echocardiography.[10][13][24] Deformation imaging has also been shown to be useful in following recovery of an infarcted myocardial area, to ascertain the amount of Myocardial stunning vs. necrosis.[25][26][27]
Myocardial ischemia
In stress echocardiography (see Cardiac stress test), the regional dysfunction due to ischemia will become evident when the myocardial oxygen demand surpasses the Coronary flow reserve of a stenosed coronary artery. Strain rate imaging during stress has been shown to give incremental value over ordinary echocardiography, both diagnostic[28][29] and prognostic.[30] In stress echo, the increased heart rate has speckle tracking at a disadvantage, due to the limited frame rate that affects tracking at higher heart rates.
Ventricular dyssynchrony
In Left bundle branch block (LBBB), the asynchronous activation of the left ventricle gives asynchronous contraction as well. This asynchrony can be visualised by ordinary echocardiography.[31] It can also be demonstrated by tissue velocities, but strain rate imaging will in addition demonstrate the distribution of the asynchrony, and the demonstration of the amount of inefficient work done by the asynchronous ventricle. Disappointingly, large scale studies have not been able to establish additional echo criteria for selection of Heart failure patients with LBBB who may respond to Cardiac resynchronization therapy,[32] although smaller studies are promising[33]
Global function
In later years, Global strain by speckle tracking has achieved popularity as the global functional measure. It has an advantage over Ejection fraction (EF), it shows reduced cardiac function also in hypertrophic hearts with small ventricles and normal ejection fraction (HFNEF), which is often seen in Hypertensive heart disease, Hypertrophic cardiomyopathy and Aortic stenosis. The EF is not a pure functional measure, as it is also dependent on wall thickness[34] It has also been shown to be more sensitive than EF.[35][36] However, the incremental diagnostic and prognostic value of measuring LV shortening was already shown for the absolute measure [37][38][39][40]
Global strain is basically LV shortening/LV end diastolic length, which means that this is a normalisation of LV shortening for LV heart size. It remains to be proven that this actually confers additional information.
References
- Heimdal A, Stoylen A, Torp H, Skjaerpe T. Real-time strain rate imaging of the left ventricle by ultrasound. J Am Soc Echocardiogr 1998 Nov;11(11):1013-19
- Fleming AD, Xia X, McDicken WN, Sutherland GR, Fenn L. Myocardial velocity gradients detected by Doppler imaging.Br J Radiol. 1994 Jul;67(799):679-88.
- Bohs LN, Trahey GE. A novel method for angle independent ultrasonic imaging of blood flow and tissue motion. IEEE Trans Biomed Eng. 1991 Mar;38(3):280-6.
- Kaluzynski K, Chen X, Emelianov SY, Skovoroda AR, O'Donnell M. Strain rate imaging using two-dimensional speckle tracking. IEEE Trans Ultrason Ferroelectr Freq Control. 2001 Jul;48(4):1111-23.
- Mirsky I, Parmley WW. Assessment of Passive Elastic stiffness for isolated heart muscle and the intact heart. Circ Res 1973;33: 233-243.
- Asbjørn Støylen. Strain rate Imaging of the left ventricle by ultrasound. Feasibility, clinical validation and physiological aspects. NTNU 2001
- Andreas Heimdal. Doppler based ultrasound imaging methods for noninvasive assessment of tissue viability, NTNU 1999.
- Hamilton WF, Rompf JH. Movements of the base of the ventricle and relative constancy of the cardiac volume. Am J Physiol 1932;102:559-65.
- Hoffman EA, Ritman EL. Invariant total heart volume in the intact thorax. Am J Physiol 1985;249:883-90.
- Stoylen A, Heimdal A Bjornstad K, Wiseth R, Vik-Mo H, Torp H, Angelsen B, Skjærpe T. Strain rate imaging by ultrasound in the diagnosis of coronary artery disease. J Am Soc Echocardiogr 2000 Dec;13(12):1053-64
- Heimdal A, D’hooge J, Bijnens B, Sutherland G, Torp H. In vitro validation of in plane strain rate imaging, a new ultrasound technique for evaluating regional myocardial deformation based on tissue Doppler imaging. Echocardiography 1998,15(8 part 2):S40. Abstract.
- Urheim S, Edvardsen T, Torp H, Angelsen B, Smiseth OA. Myocardial strain by Doppler echocardiography. Validation of a new method to quantify regional myocardial function. Circulation 2000 Sep 5;102(10):1158-64
- Stoylen A, Heimdal A, Bjornstad K, Torp H, Skjaerpe T. Strain rate imaging by ultrasound in the diagnosis of regional dysfunction of the left ventricle. Echocardiography 1999 May; 16(4):321-9
- Edvardsen T, Gerber BL, Garot J, Bluemke DA, Lima JA, Smiseth OA. Quantitative assessment of intrinsic regional myocardial deformation by Doppler strain rate echocardiography in humans: validation against three-dimensional tagged magnetic resonance imaging. Circulation. 2002 Jul 2;106(1):50-6
- Cho GY, Chan J, Leano R, Strudwick M, Marwick TH. Comparison of two-dimensional speckle and tissue velocity based strain and validation with harmonic phase magnetic resonance imaging. Am J Cardiol 2006; 97:1661-6
- Insana MF, Wagner RF, Garra BS, Momenan R, Shawker TH. Pattern recognition methods for optimizing multivariate tissue signatures in diagnostic ultrasound. Ultrason Imaging. 1986 Jul;8(3):165-80
- Bohs LN, Friemel BH, Trahey GE. Experimental velocity profiles and volumetric flow via two-dimensional speckle tracking. Ultrasound Med Biol. 1995;21(7):885-98
- Ingul CB, Torp H, Aase SA, Berg S, Stoylen A, Slordahl SA. Automated analysis of strain rate and strain: feasibility and clinical implications. J Am Soc Echocardiogr. 2005 May;18(5):411-8.
- Amundsen BH, Crosby J, Steen PA, Torp H, Slørdahl SA, Støylen A. Regional myocardial long-axis strain and strain rate measured by different tissue Doppler and speckle tracking echocardiography methods: a comparison with tagged magnetic resonance imaging. Eur J Echocardiogr. 2009 Mar;10(2):229-37
- Modesto KM, Cauduro S, Dispenzieri A, Khandheria B, Belohlavek M, Lysyansky P, Friedman Z, Gertz M, Abraham TP.Two-dimensional acoustic pattern derived strain parameters closely correlate with one-dimensional tissue Doppler derived strain measurements. Eur J Echocardiogr. 2006 Aug;7(4):315-21
- Helle-Valle T, Crosby J, Edvardsen T, Lyseggen E, Amundsen BH, Smith HJ, Rosen BD, Lima JA, Torp H, Ihlen H, Smiseth OA. New noninvasive method for assessment of left ventricular rotation: speckle tracking echocardiography. Circulation. 2005 Nov 15;112(20):3149-56
- Brodin LA, van der Linden J, Olstad B. Echocardiographic functional images based on tissue velocity information. Herz 1998, 23:1183-1199
- Dalen H, Thorstensen A, Aase SA, Ingul CB, Torp H, Vatten LJ, Stoylen A. Segmental and global longitudinal strain and strain rate based on echocardiography of 1266 healthy individuals: the HUNT study in Norway. Eur J Echocardiogr. 2010 Mar;11(2):176-83. Epub 2009 Nov 28.
- Voigt JU, Arnold MF, Karlsson M, Hubbert L, Kukulski T, Hatle L, Sutherland GR.Assessment of regional longitudinal myocardial strain rate derived from doppler myocardial imaging indexes in normal and infarcted myocardium.J Am Soc Echocardiogr. 2000 Jun;13(6):588-98.
- Ingul CB, Stoylen A, Slordahl SA. Recovery of stunned myocardium in acute myocardial infarction quantified by strain rate imaging: a clinical study. J Am Soc Echocardiogr. 2005 May;18(5):401-10.
- Weidemann F, Wacker C, Rauch A, Bauer WR, Bijnens B, Sutherland GR, et al. Sequential changes of myocardial function during acute myocardial infarction, in the early and chronic phase after coronary intervention described by ultrasonic strain rate imaging. J Am Soc Echocardiogr 2006; 19:839-47
- Ingul CB, Malm S, Refsdal E, Hegbom K, Amundsen BH, Støylen A.Recovery of function after acute myocardial infarction evaluated by tissue Doppler strain and strain rate. J Am Soc Echocardiogr. 2010 Apr;23(4):432-8
- Voigt JU, Exner B, Schmiedehausen K, Huchzermeyer C, Reulbach U, Nixdorff U, Platsch G, Kuwert T, Daniel WG, Flachskampf FA. Strain-rate imaging during dobutamine stress echocardiography provides objective evidence of inducible ischemia. Circulation. 2003;107:2120-6
- Ingul CB, Stoylen A, Slordahl SA, Wiseth R, Burgess M, Marwick TH. Automated analysis of myocardial deformation at dobutamine stress echocardiography: an angiographic validation. J Am Coll Cardiol. 2007 Apr 17;49(15):1651-
- Bjork Ingul C, Rozis E, Slordahl SA, Marwick TH. Incremental value of strain rate imaging to wall motion analysis for prediction of outcome in patients undergoing dobutamine stress echocardiography.Circulation. 2007 Mar 13;115(10):1252-9
- Dillon JC, Chang S, Feigenbaum H. Echocardiographic manifestations of left bundle branch block.Circulation. 1974 May;49(5):876-80
- Chung ES, Leon AR, Tavazzi L, Sun JP, Nihoyannopoulos P, Merlino J, Abraham WT, Ghio S, Leclercq C, Bax JJ, Yu CM, Gorcsan J 3rd, St John Sutton M, De Sutter J, Murillo J.Results of the Predictors of Response to CRT (PROSPECT) trial. Circulation. 2008 May 20;117(20):2608-16
- Risum N, Jons C, Olsen NT, Fritz-Hansen T, Bruun NE, Hojgaard MV, Valeur N, Kronborg MB, Kisslo J, Sogaard P. Simple regional strain pattern analysis to predict response to cardiac resynchronization therapy: rationale, initial results, and advantages. Am Heart J. 2012 Apr;163(4):697-704
- Maciver DH. A new method for quantification of left ventricular systolic function using a corrected ejection fraction.Eur J Echocardiogr. 2011 Mar;12(3):228-34
- Gjesdal O, Hopp E, Vartdal T, Lunde K, Helle-Valle T, Aakhus S, Smith HJ, Ihlen H, Edvardsen T. Global longitudinal strain measured by two-dimensional speckle tracking echocardiography is closely related to myocardial infarct size in chronic ischaemic heart disease.Clin Sci (Lond). 2007 Sep;113(6):287-96
- Eek C, Grenne B, Brunvand H, Aakhus S, Endresen K, Hol PK, Smith HJ, Smiseth OA, Edvardsen T, Skulstad H.Strain echocardiography and wall motion score index predicts final infarct size in patients with non-ST-segment-elevation myocardial infarction. Circ Cardiovasc Imaging. 2010 Mar;3(2):187-94
- Willenheimer R, Cline C, Erhardt L, Israelsson B. Left ventricular atrioventricular plane displacement: an echocardiographic technique for rapid assessment of prognosis in heart failure. Heart 1997;78:230-36
- Nagueh SF, Bachinski LL, Meyer D, Hill R, Zoghbi WA, Tam JW, Quiñones MA, Roberts R, Marian AJ.Tissue Doppler imaging consistently detects myocardial abnormalities in patients with hypertrophic cardiomyopathy and provides a novel means for an early diagnosis before and independently of hypertrophy. Circulation. 2001 Jul 10;104(2):128-30
- Ballo P, Barone D, Bocelli A, Motto A, Mondillo S. Left ventricular longitudinal systolic dysfunction is an independent marker of cardiovascular risk in patients with hypertension.Am J Hypertens. 2008 Sep;21(9):1047-54
- Sveälv BG, Olofsson EL, Andersson B. Ventricular long-axis function is of major importance for long-term survival in patients with heart failure. Heart. 2008 Mar;94(3):284-9
Further reading
External links
Books
Sutherland; Hatle; Claus; D'hooge;Bijnens (2006) Doppler Myocardial Imaging. BSWK, Belgium. ISBN 978-90-810592-1-3
Marwick; Yu; Sun (2007) Myocardial Imaging: Tissue Doppler and Speckle Tracking. Wiley-Blackwell. ISBN 978-1-4051-6113-8