Clarke Error Grid
The Clarke Error Grid Analysis (EGA) was developed in 1987 to quantify clinical accuracy of patient estimates of their current blood glucose as compared to the blood glucose value obtained in their meter.[1] It was then used to quantify the clinical accuracy of blood glucose estimates generated by meters as compared to a reference value. A description of the EGA appeared in Diabetes Care in 1987.[2] Eventually, the EGA became accepted as one of the “gold standards” for determining the accuracy of blood glucose meters.
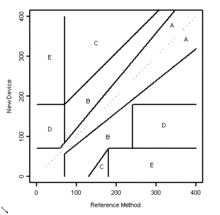
The Clarke Error Grid
The grid breaks down a scatterplot of a reference glucose meter and an evaluated glucose meter into five regions:
- Region A are those values within 20% of the reference sensor,
- Region B contains points that are outside of 20% but would not lead to inappropriate treatment,
- Region C are those points leading to unnecessary treatment,
- Region D are those points indicating a potentially dangerous failure to detect hypoglycemia or hyperglycemia, and
- Region E are those points that would confuse treatment of hypoglycemia for hyperglycemia and vice versa.
References
- Clarke WL, Cox D, Gonder-Frederick LA, Carter W, Pohl SL: Evaluating clinical accuracy of systems for self-monitoring of blood glucose. Diabetes Care 10:622–628,1987
- http://care.diabetesjournals.org/cgi/content/abstract/10/5/622?ijkey=959ce0073ff9f91dfd78630b4259267d96a9db0f&keytype2=tf_ipsecsha
This article is issued from
Wikipedia.
The text is licensed under Creative
Commons - Attribution - Sharealike.
Additional terms may apply for the media files.