

Screen Time vs. Lean Time Infographic
 ShareCompartir
Download the infographic: 8-10 Age Group; 11-14 Age Group; 15-18 Age Group
Copy the code below to embed this infographic into your site.
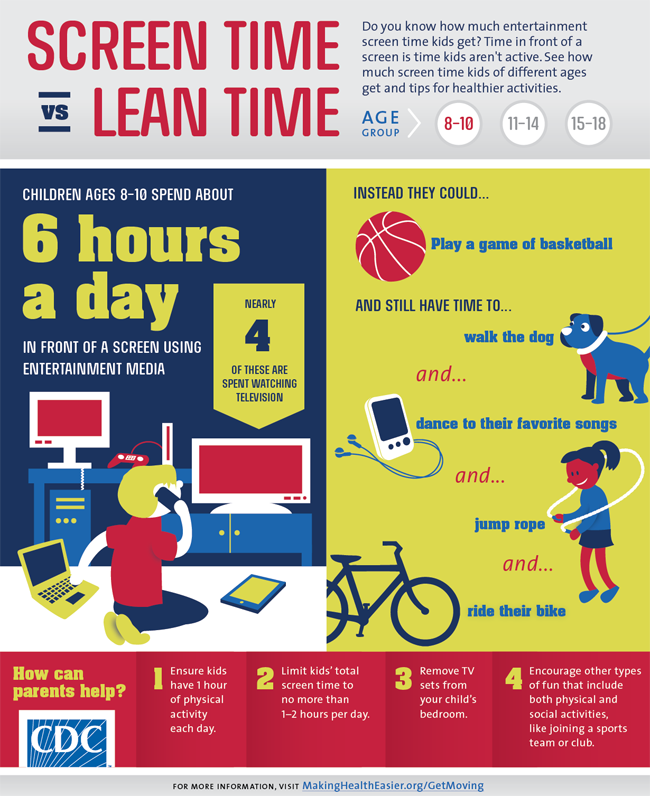
About Screen Time
According to the Kaiser Family Foundation, kids ages 8-18 now spend, on average, a whopping 7.5 hours in front of a screen for entertainment each day, 4.5 of which are spent watching TV. Over a year, that adds up to 114 full days watching a screen for fun. That’s just the time they spend in front of a screen for entertainment. It doesn’t include the time they spend on the computer at school for educational purposes or at home for homework.
The CDC recommends kids get at least 60 minutes of physical activity each day. The time kids spend watching TV, playing video games, surfing the web, is time they could be physically active. Click the Screen Time vs. Lean Time infographic to see how much time kids spend in front of a screen, and tips for parents. Add a Screen Time vs. Lean Time button to your page, or find more information for parents and community members in the resource section.
Resources:
- American Academy of Pediatrics (AAP):
- CDC: Strategies to Prevent Obesity
- Screen-Free Week
Screen Time vs. Lean Time Buttons

Get moving 180x150


- Page last reviewed: March 13, 2017
- Page last updated: March 13, 2017
- Content source: