 (1)
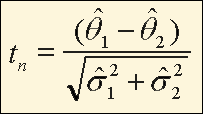
(1)The t-test is used to test the null hypothesis that two population means or proportions, θ1 and θ2, are equal OR, equivalently, that the difference between two population means or proportions is zero. To test this hypothesis, assuming the covariance is small, as is the case with NHANES data, the following formula is used
 (1)
(1)where,
![]() 1 is
an estimate of θ1 based
on a probability sample,
1 is
an estimate of θ1 based
on a probability sample,
![]() 1 is
an estimate of the standard error of
1 is
an estimate of the standard error of ![]() 1,
1,
![]() 2 is
an estimate of θ2,
2 is
an estimate of θ2,
and ![]() 2 is an
estimate of the standard error of
2 is an
estimate of the standard error of ![]() 2.
2.
In instances where the t statistic is based on a small number of independent pieces of information (i.e. a small number of degrees of freedom [<30]), the statistic given in equation 1 follows a Student's t distribution with mean=0 and unit variance with n degrees of freedom. In the NHANES 1999-2002 sample, the degrees of freedom depend on the number of first stage units, or PSUs, containing observations and is defined as the number of PSUs minus the number of strata. (See Sample Design module for more information.)
The equality of means is usually tested at the .05 level of significance.
References:
Cochran, WG. Sampling Techniques. John Wiley & Sons. 1977.
Lohr SL. Sampling: Design and Analysis. Duxbury Press. Pacific Grove 1999.