Early attempts to compensate for the random error from the use of 24-hour recalls by averaging multiple (two to seven) 24-hour recalls per respondent were deemed unsatisfactory due to high respondent burden. Moreover, averages over a small number of days do not adequately represent individual usual intakes due to the large amount of random error. Thus, more sophisticated methods based on statistical modeling evolved.
A few statistical methods have been developed to estimate the distribution of usual intake in a population and will be described in detail later in this section. These include the National Research Council (NRC) Method (National Research Council, 1986), the Iowa State University (ISU Method) (Nusser et al., 1996a), a simplification of the ISU Method called the Best Power (BP) Method (Dodd, 1996), the Iowa State University Foods (ISUF) Method (Nusser et al., 1996b), and a statistical method developed at the National Cancer Institute (NCI Method) (Tooze, 2006). Each statistical method makes the assumption that the 24-hour recall is prone to random, not systematic error. For estimating dietary constituents that are ubiquitously-consumed (consumed nearly every day by nearly everyone; generally refers to nutrients) and episodically-consumed (consumed sporadically and not by everyone; generally refers to foods), methods also must meet the following challenges:
A. Distinguish within-person from between-person variation, and
B. Account for consumption-day amounts that are positively skewed.
For episodically-consumed dietary constituents, two additional challenges must be addressed:
C. Account for reported days without consumption of a dietary constituent, and
D. Allow for the correlation between the probability of consuming a dietary constituent and the consumption-day amount.
There is often interest in a final challenge, which is applicable to both ubiquitously-consumed and episodically-consumed dietary constituents:
E. Relate covariate information to usual intake.
With 2 days of 24-hour recalls, all of the statistical methods that have been developed meet Challenge A. Between-person variation in usual intake represents the variability of usual intake of a dietary constituent in the population. Within-person day to day variability and measurement error is a nuisance for estimating usual intake. Therefore, the statistical methods isolate the between-person variation and then estimate the distribution of usual intake from the estimate of the between-person variance. The partitioning done in the statistical models is similar to the partitioning of total variability in a random ANOVA model into variability between individuals and variability within individuals.
Unfortunately in dietary assessment, dietary constituents are rarely normally distributed, yet the statistical methods used require a normality assumption. Therefore these methods must meet Challenge B, to account for positively (or right) skewed distributions (having a small number of very large values instead of exhibiting a normal distribution’s symmetry about its mean). To reconcile the desire to use the statistical properties of the normal distribution with the need to model inherently non-normal data, statisticians often assume that a normal distribution approximates the distribution of a (nonlinear) transformation of the observed data, rather than the observed data themselves. For example, if the data have a highly skewed distribution, then the distribution obtained by taking the logarithm of each observation may be symmetric, and therefore be better-approximated by a normal distribution. In this example, we say that the data have been “transformed” to the log scale. For less-skewed data, weaker transformations, such as the square root and cube root, are often sufficient to achieve approximate normality. If a particular transformation produces normally-distributed data, the distribution of untransformed data can be described in terms of the normal distribution and the transformation.
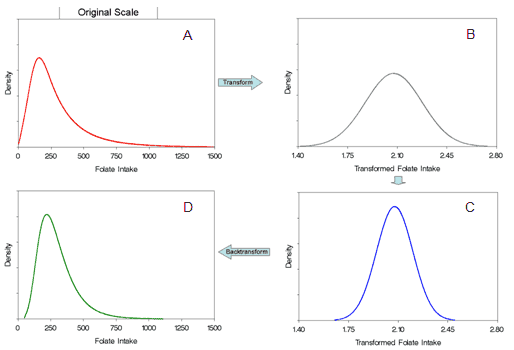
The general process used in modeling is illustrated in Figure 5. On the original scale, data are not normally distributed (A). First, data are transformed to approximate normality (B). With normally distributed data, the distribution can be fully described by the mean and variance. Next, the within-person variation is removed, leading to a “skinnier” distribution, reflecting the distribution of usual intake (C). Finally, the data are backtransformed to the original scale (D). The backtransformation is the expression that related values in the transformed scale to usual intake in the original scale. All of the methods use this general approach, although there are differences as to how it is done. The methods vary regarding the assumption as to whether the intake is unbiased on the original or the transformed scale. When the unbiasedness is assumed on original scale, the methods must apply a “correction factor” so the mean of the backtransformed data is the same as the mean of the data on the original scale. If unbiasedness is assumed on the transformed scale, the correction factor is not necessary (for details see Dodd et al., 2006).
Figure 5. An illustration (for folate) of the transformation process used in statistical modeling of usual intake
When dietary constituents are consumed episodically, a spike in the distribution at zero will occur as a result of observations with no consumption on recall days. Therefore, statistical methods for estimating usual intake of episodically-consumed dietary constituents must meet Challenge C, accounting for reported days without consumption of the dietary constituent. Furthermore, the probability of consuming a dietary constituent is often positively correlated with the amount that is consumed on the consumption day. For example, people who have a higher probability of consuming whole grains tend to eat more of them on the days on which they are eaten. Statistical methods must meet Challenge D, allowing for the positive correlation between consuming a constituent and the amount consumed on a consumption day.
Finally, for all dietary constituents, there is often interest in incorporating covariates into statistical modeling. This is Challenge E. Modules 19-21 cover various aspects of this challenge:
days of recall data for a person. This is referred to as the within-person means method in this tutorial. Unfortunately, this method usually leads to biased estimates of the prevalence of either inadequate or excess food intake because it does not meet any of the challenges listed above, especially challenge A. The National Research Council (NRC) Method (National Research Council, 1986) was the first statistical method developed to estimate the distribution of ubiquitously consumed dietary constituents; it meets challenge A and challenge B when a simple transformation to approximate normality can be used. Later, researchers at Iowa State University (ISU Method) (Nusser et al., 1996) proposed the use of a more complex model, which incorporated a two-step transformation procedure. This procedure, which can be used with complex datasets, meets challenges A and B, as does a simplification of the ISU Method called the Best Power (BP) Method, (Dodd, 1996) when a simple transformation to approximate normality is appropriate. None of these methods incorporate covariates (Challenge E), although the ISU Method allows for preliminary data adjustments such as interview sequence or day of the week. Because these methods meet challenges A and B, they almost always produce less biased estimates of usual intake than the within-person mean.
Another important distinction between the NRC Method and the ISU and BP Methods is the assumption regarding whether the 24-hour recall data is unbiased on the original scale or the transformed scale. The NRC Method assumes unbiasedness on the transformed scale, whereas the ISU and BP method assume unbiasedness on the original scale.
Until recently, only two methods have been developed to estimate the distribution of usual intake of episodically-consumed dietary constitutents using 2 days of 24-hour recall data. The Iowa State University Foods (ISUF) Method meets challenges A, B, and C. The premise of the ISUF Method is that usual intake is equal to the probability of consumption on a given day times the average amount consumed on a "consumption day." It models zero observations separately from positive (consumption day) observations; the ISU Method is used to model the positive observations. However, the method does not allow for correlation between probability and amount (Challenge D) and, therefore, is not applicable for use in modeling dietary constituents that exhibit this positive correlation. Additionally, it cannot incorporate covariate information regarding usual intake (Challenge E), although it does adjust for day of week and sequence effects. A new statistical method has been developed at the National Cancer Institute (NCI Method) to meet all five of the challenges noted above. This method is described in detail in Task 3 of this module.
The macros to fit the NCI method may be downloaded from the NCI website. Software for fitting the ISU method is available from the Center for Survey Statistics and Methodology at Iowa State University.
Dodd KW. A Technical Guide to C-SIDE: Software for Intake Distribution Estimation. 1996. Technical Report 96-TR 32, Dietary Assessment Research Series Report 9, Department of Statistics and Center for Agricultural and Rural Development. Iowa State University.
Dodd KW, Guenther PM, Freedman LS, Subar AF, Kipnis V, Midthune D, Tooze JA, Krebs-Smith SM. Statistical methods for estimating usual intake of nutrients and foods: a review of the theory. Journal of the American Dietetics Association 2006 Oct;106(10):1575-1587.
National Research Council. Nutrient Adequacy: Assessment Using Food Consumption Surveys. 1986. Washington, DC, National Academy Press.
Nusser SM, Carriquiry AL, Dodd KW, Fuller WA. A semi-parametric transformation approach to estimating usual nutrient intake distributions. Journal of the American Statistical Association 1996; 91:1440-1449.
Nusser SM, Fuller WA, Guenther PM. Estimation of usual dietary intake distributions: adjusting for measurement error and nonnormality in 24-hour food intake data. In: Trewin D, ed. Survey Measurement and Process Quality. New York, NY: Wiley; 1996:689-709.
![]() Close Window
to return to module page.
Close Window
to return to module page.