The concept of “usual” or long-term average intake is important because dietary recommendations are intended to be met over time and diet-health hypotheses are based on dietary intakes over the long term. However, there is no perfect dietary assessment tool to measure usual intake; all self-report dietary assessment instruments are prone to error.
In statistics, an “error” is a deviation of the sample from the true mean. It is estimated by calculating the residual (i.e., the difference between a point and the sample mean). The variance is the sum of the squared residuals, divided by the sample size (usually N-1 to create an unbiased estimate). Lots of error leads to a large variance; a small amount of error leads to a small variance.
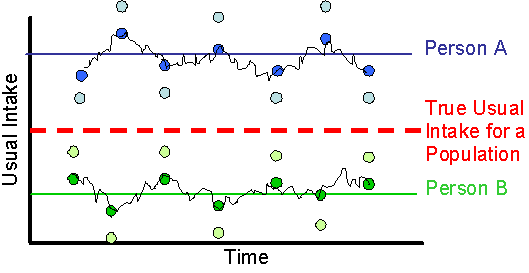
When considering variation in dietary intake data, it is important to distinguish variation between people from variation within people. Between-person variability is a function of the difference between a person’s usual intake and the population’s usual intake. However, within a person, we also expect variation around his/her usual intake. This type of variation usually takes two forms: day-to-day variability and measurement error. These are depicted graphically in Figure 1. However, we cannot usually distinguish between these two sources of error, so they are jointly referred to as “within-person variation”.
Figure 1. Between-person and within-person variation. Between-person variation is represented by the difference between Person A’s and Person B’s usual intake and the population’s usual intake. The dark blue dots (and jagged line) represent day to day variation in intake, whereas the light blue dots represent the measurement of intake. Taken together, these comprise within-person variation.

Within-person variation may be random, resulting in an estimate of usual intake that is unbiased (Figure 2a), meaning that a person’s true usual intake is estimated accurately on average, although with some error. However, measurement errors also may be systematic, which lead to bias (Figure 2b). These are “mistakes” in the measurement. For example, a person may not report intake of sugar in coffee, but drink many cups of coffee per day, resulting in a biased estimate of sugar intake.