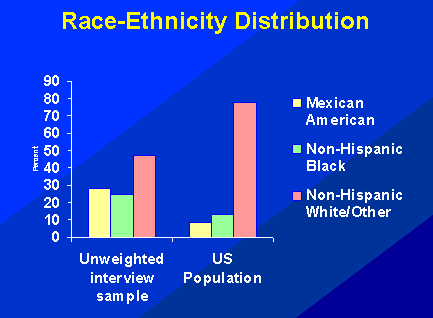
If you look at the graphs above, you will see that the unweighted interview sample from NHANES 1999-2002 is composed of 47% non-Hispanic white and Other participants, 25% non-Hispanic Black participants, and 28% Mexican American participants. The US civilian noninstitutionalized population in 2000, in contrast, was 78% non-Hispanic white and Other, 13% non-Hispanic black, and 9% Mexican American. Therefore, unweighted estimates for any survey item associated with race/ethnicity would be biased if weights were not used, because estimates would not be representative of the actual U.S. civilian noninstitutionalized population.
Below are three examples of estimates calculated using NHANES 1999-2002 data. In all examples, unweighted and correctly weighted estimates are shown to demonstrate the effects of not including the proper sample weights in the analysis.
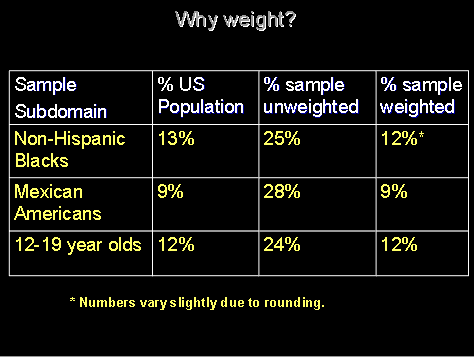
In the first example, the data from NHANES 1999-2002 in the table below shows that weighted estimates reflect the U.S. civilian noninstitutionalized population very closely, but unweighted estimates are much higher in oversampled subgroups, such as non-Hispanic blacks, Mexican Americans, and persons age 12-19 years.
Thirteen percent of the U.S. 2000 Census civilian noninstitutionalized population was non-Hispanic black, the unweighted sample for NHANES 1999-2002 was 25% non-Hispanic black because non-Hispanic blacks were oversampled in NHANES. Once the appropriate weights are applied, the weighted sample was only 12% non-Hispanic black. This estimate is much closer to that seen in the 2000 U.S. Census civilian noninstitutionalized population (numbers differ slightly due to rounding).
Similarly, if one looks at Mexican Americans and persons age 12-19 years--two subpopulations also oversampled in NHANES--you can see that the U.S. census civilian noninstitutionalized population and the weighted sample consist of both 9% Mexican Americans and 12% persons age 12-19 years but the percents in the unweighted sample (28% and 24% respectively) were much greater for these two subpopulations.
In the next two examples, high LDL estimates were calculated for non-Hispanic blacks age 20 years and over and the herpes positive estimate was calculated for males age 40-49 years.
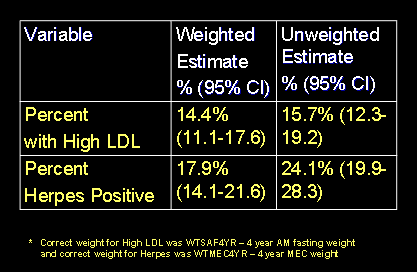
The estimates differ greatly when they are calculated with the correct weight compared to when they are calculated without being weighted at all. This is especially true in the herpes positive example, because being herpes positive is closely related to non-Hispanic black race/ethnicity, which is one of the subgroups oversampled in the survey. Therefore, the effect of not accounting for sample weights is even more pronounced when oversampled subgroups are included in the analysis.