Error processing SSI file
Error processing SSI file
Weekly Report: Influenza Summary Update
Week ending May 19, 2007-Week 20
Error processing SSI fileThis is the final report of the 2006-07 season. Surveillance resumes for the 2007-08 season October 12, 2007.
Synopsis:
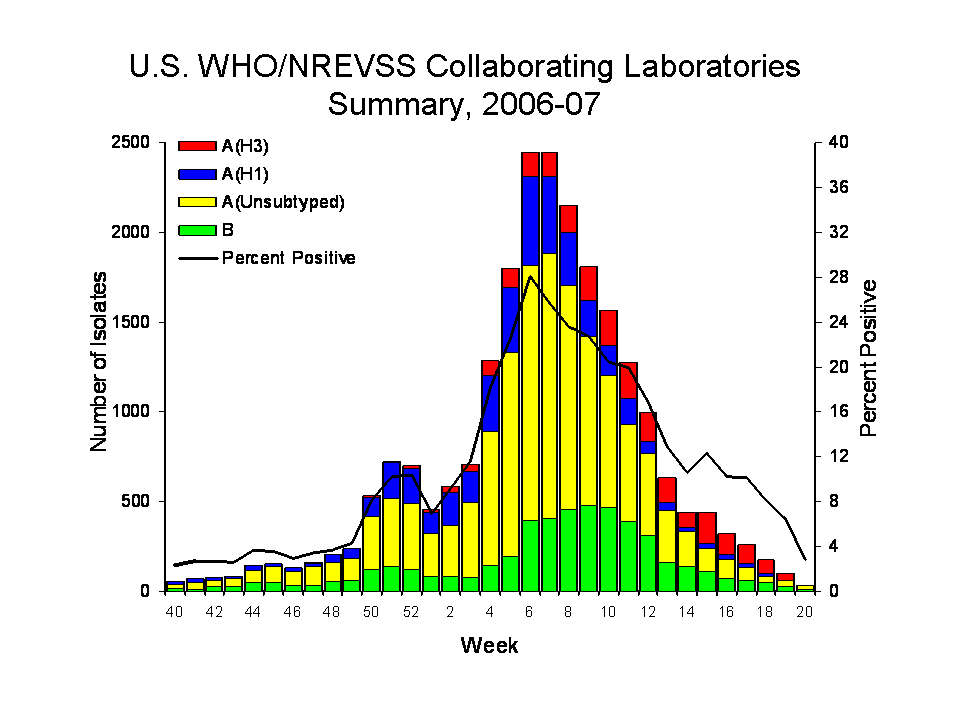
Influenza activity in the United States peaked in mid-February and continued to decrease during week 20 (May 13 - 19, 2007)*. Data from the U.S. World Health Organization (WHO) and National Respiratory and Enteric Virus Surveillance System (NREVSS) collaborating laboratories indicated a decrease in the number of specimens testing positive for influenza. The percentage of visits for ILI to sentinel providers decreased during week 20 and was below the national baseline for the ninth consecutive week. New York City and 20 states reported sporadic activity; and the District of Columbia and 30 states reported no influenza activity. The percent of deaths due to pneumonia and influenza has remained below baseline levels for the entire influenza season to date.
Laboratory Surveillance*:
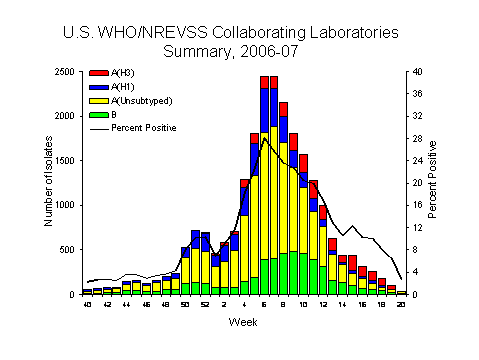
During week 20, WHO and NREVSS laboratories reported 1 063 specimens tested for influenza viruses, 30 (2.8%) of which were positive: 19 influenza A viruses that were not subtyped and 11 influenza B viruses.
Since October 1, 2006, WHO and NREVSS laboratories have tested a total of 172 735 specimens for influenza viruses and 23 181 (13.4%) were positive. Among the 23 181 influenza viruses, 18 392 (79.3%) were influenza A viruses and 4 789 (20.7%) were influenza B viruses. Six thousand one hundred and two (33.2%) of the 18 392 influenza A viruses have been subtyped: 3 872 (63.5%) were influenza A (H1) viruses and 2 230 (36.5%) were influenza A (H3) viruses. While influenza A (H1) viruses were predominant this season overall, influenza A (H3) viruses have been reported more frequently than influenza A (H1) viruses since early March. Among specimens tested for influenza during the most recent three weeks (April 29 - May 19, 2007), on a regional basis, only the South Atlantic and Pacific regions reported >10% of specimens testing positive.
View WHO-NREVSS
Regional Bar Charts |
View
Chart Data |
View
Full Screen
Composition of the 2006-07 Influenza Vaccine:
WHO has recommended that the 2007-08 trivalent influenza vaccine for the Northern Hemisphere contain A/Solomon Islands/3/2006-like (H1N1), A/Wisconsin/67/2005-like (H3N2), and B/Malaysia/2506/2004-like viruses. The influenza A (H1N1) component has been changed from the 2006-07 season vaccine components. A/Solomon Islands/3/2006 is a recent antigenic variant of the current vaccine strain A/New Caledonia/20/99. The influenza A (H3N2) and influenza B components remain the same. B/Ohio/1/2005 is antigenically equivalent to B/Malaysia/2506/2004. This recommendation was based on antigenic analyses of recently isolated influenza viruses, epidemiologic data, and post-vaccination serologic studies in humans.
Antigenic Characterization:
CDC has antigenically characterized 740 influenza viruses [358 influenza A (H1), 173 influenza A (H3) viruses, and 209 influenza B viruses] collected by U.S. laboratories since October 1, 2006.
Influenza A (H1) [358] Three hundred thirty-one (92%) of the 358 viruses characterized were similar to A/New Caledonia/20/99-like, which is the influenza A (H1) component of the 2006-07 influenza vaccine.Influenza A (H3) [173]
Twenty-six (7%) of the 358 viruses showed somewhat reduced titers with antisera produced against A/New Caledonia/20/99 and are similar to A/Solomon Islands/3/2006-like. A/Solomon Islands/3/2006 is a recent antigenic variant of A/New Caledonia/20/99. One virus showed somewhat reduced titers with antisera produced against A/New Caledonia/20/99 and A/Solomon Islands/3/2006. Forty-three (25%) of the 173 viruses were characterized as A/Wisconsin/67/2005-like, which is the influenza A (H3) component of the 2006-07 influenza vaccine.Influenza B (B/Victoria/02/87 and B/Yamagata/16/88 lineages) [209]
One hundred and thirty (75%) of the 173 viruses showed somewhat reduced titers with antisera produced against A/Wisconsin/67/2005. A proportion of the low-reacting isolates appear to be low avid viruses because they react poorly with all antisera, including antisera made against these low reacting viruses. This indicates that these are not true antigenic variants.Victoria lineage [159]
One hundred and fifty-nine (76%) of the 209 influenza B viruses characterized belong to the B/Victoria lineage of viruses.o Eighty-five (53%) of these 159 viruses were similar to B/Ohio/01/2005, the B component of the 2006-07 influenza vaccine.Yamagata lineage [50]
o Seventy-four (47%) of these 159 viruses showed somewhat reduced titers with antisera produced against B/Ohio/01/2005.
Fifty (24%) of the 209 influenza B viruses characterized belong to the B/Yamagata lineage of viruses.
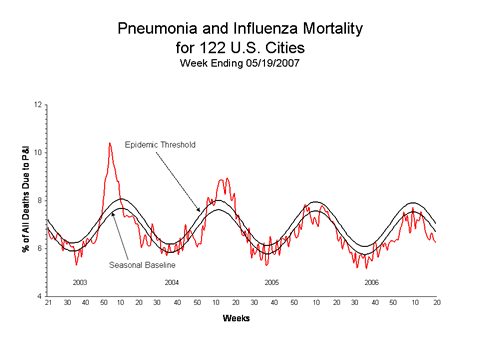
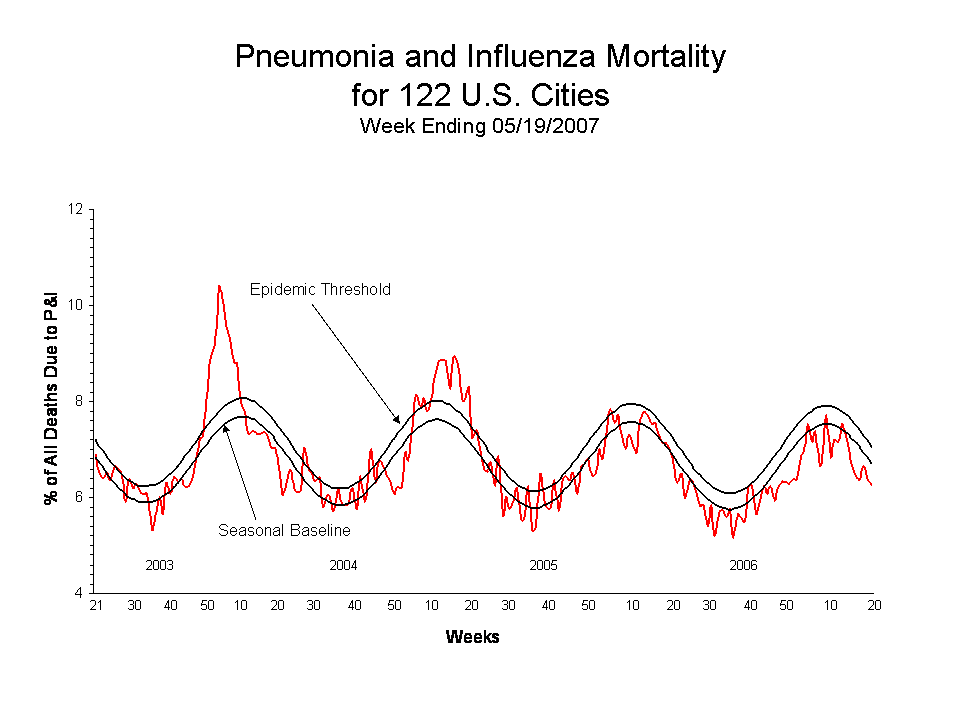
Pneumonia and Influenza (P&I) Mortality Surveillance*:
During week 20, 6.3% of all deaths were reported as due to pneumonia or influenza. This percentage is below the epidemic threshold of 7.1% for week 20.
Influenza-Associated Pediatric Mortality*:
Three influenza-associated pediatric deaths were reported during week 20. Since October 1, 2006, CDC has received 60 reports of influenza-associated pediatric deaths that occurred during the current season.
Influenza-Associated Pediatric Hospitalizations*:
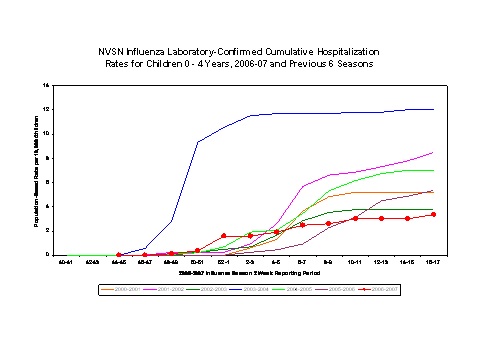
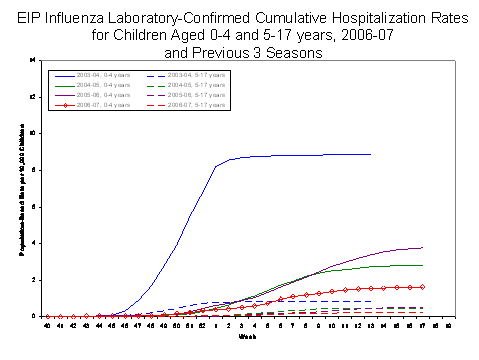
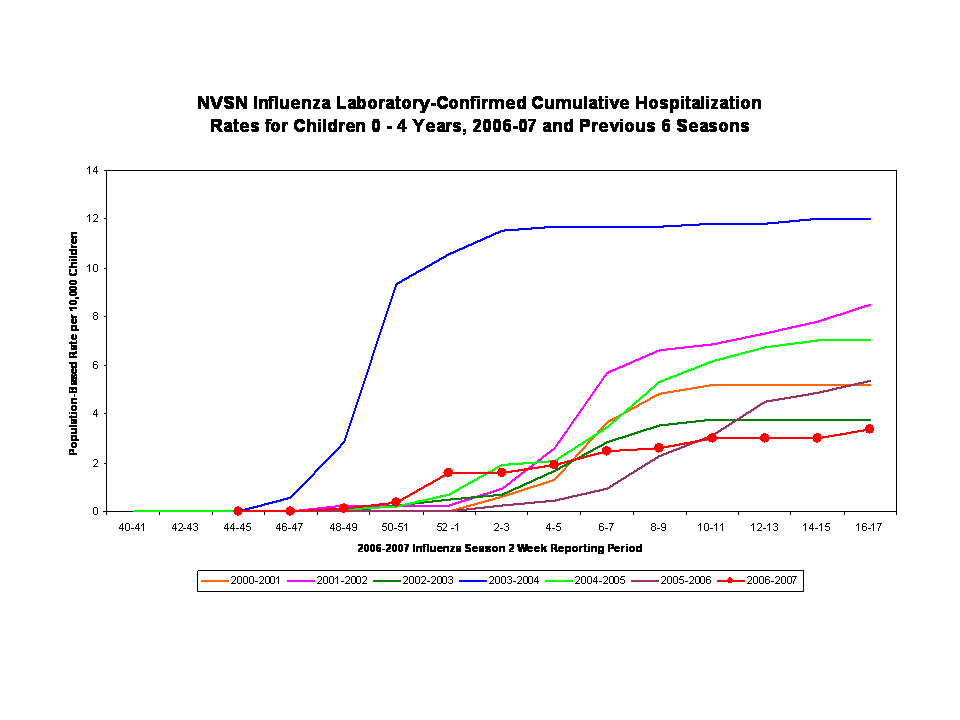
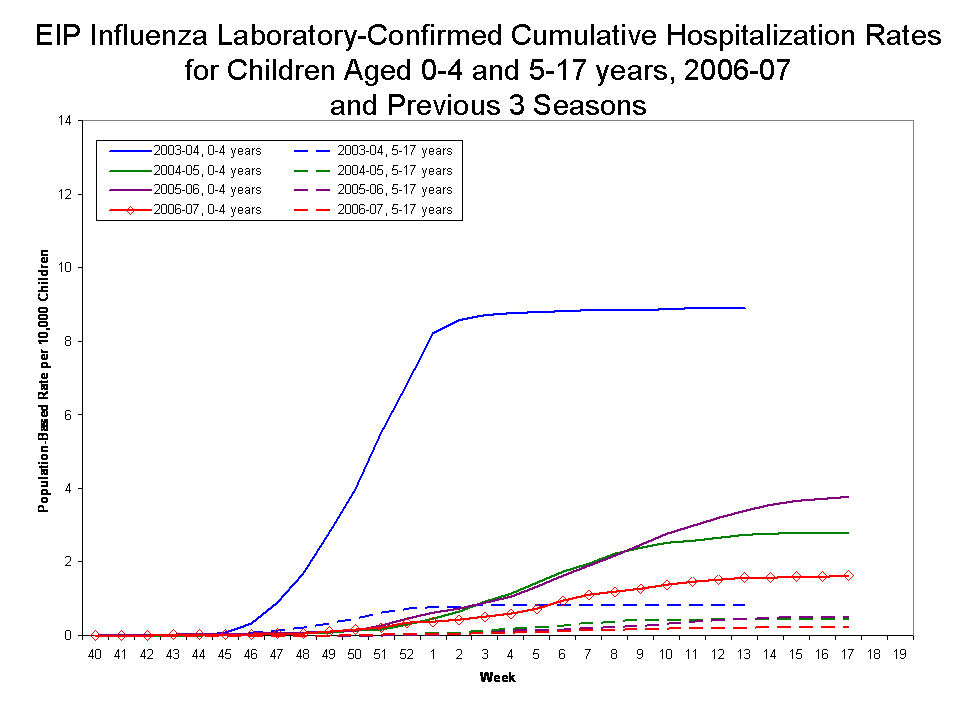
Laboratory-confirmed influenza-associated pediatric hospitalizations are monitored in two population-based surveillance networks: the Emerging Infections Program (EIP) and the New Vaccine Surveillance Network (NVSN).
As of May 12, 2007, the preliminary laboratory-confirmed influenza-associated hospitalization rate for children 0-4 years in the NVSN during the time period November 5, 2006 to April 28, 2007 was 3.35 per 10,000.
During October 1, 2006 to April 28, 2007, the preliminary laboratory-confirmed influenza-associated hospitalization rate reported by the EIP for children 0-17 years old was 0.81 per 10,000. For children aged 0-4 years and 5-17 years, the rate was 1.62 per 10 000 and 0.23 per 10,000, respectively.
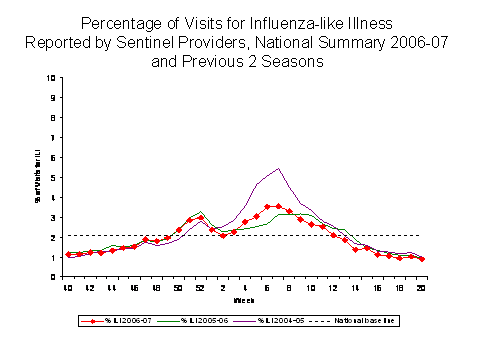
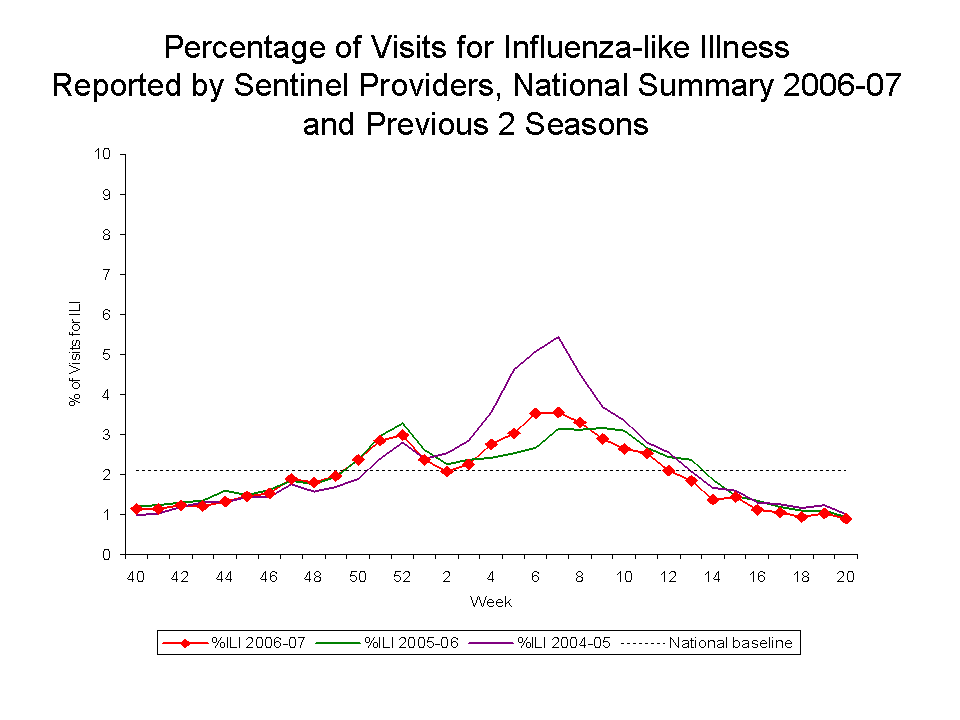
Influenza-like Illness Surveillance*:
During week 20, 0.9%** of patient visits to U.S. sentinel providers were due to ILI. This percentage is below the national baseline*** of 2.1%. All nine surveillance regions**** reported ILI below their region-specific baseline***:
View Sentinel
Providers Regional Charts |
View
Chart Data
| View Full Screen
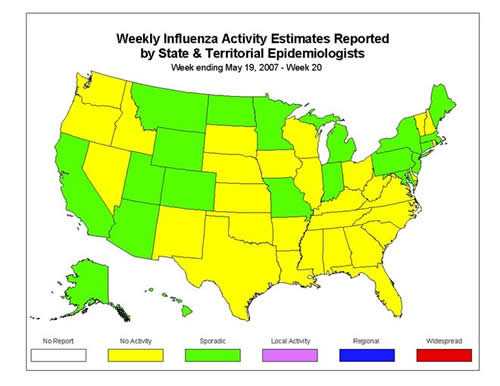
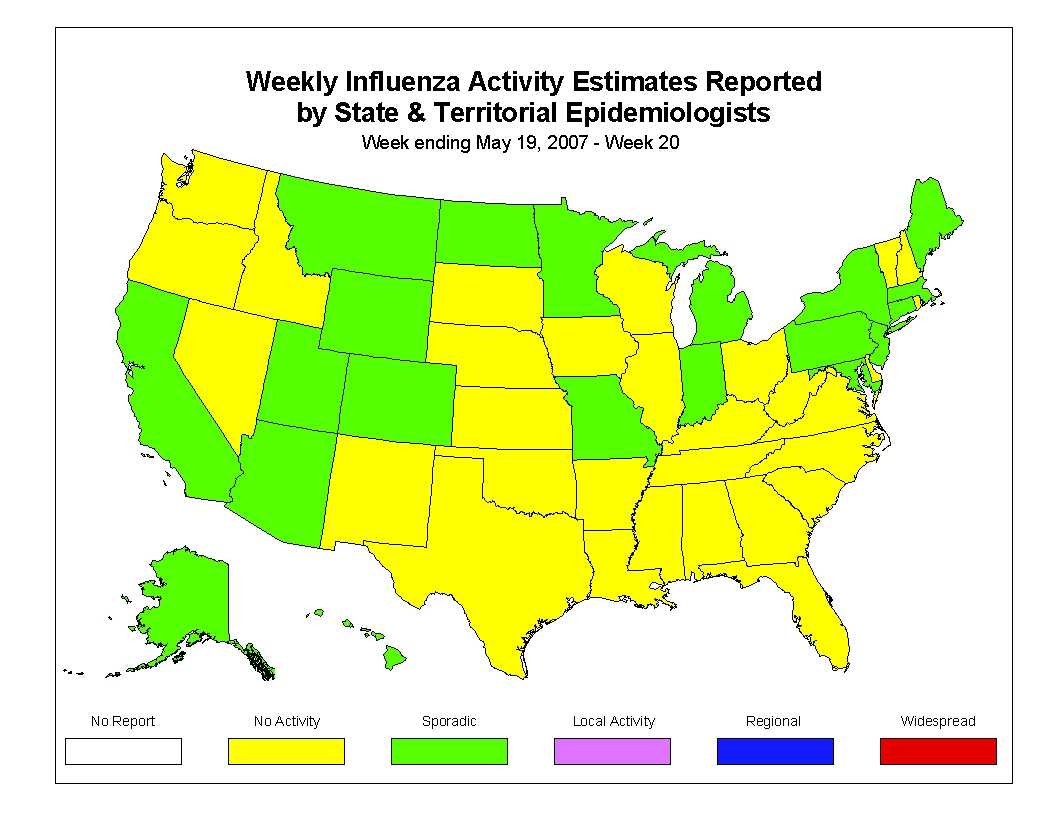
Influenza Activity as Assessed by State and Territorial Epidemiologists*:
During week 20, the following influenza activity was reported:
Sporadic activity was reported by New York City and 20 states (Alaska, Arizona, California, Colorado, Connecticut, Hawaii, Indiana, Maine, Maryland, Massachusetts, Michigan, Minnesota, Missouri, Montana, New Jersey, New York, North Dakota, Pennsylvania, Utah, and Wyoming).
The District of Columbia and 30 states (Alabama, Arkansas, Delaware, Florida, Georgia, Idaho, Illinois, Iowa, Kansas, Kentucky, Louisiana, Mississippi, Nebraska, New Hampshire, Nevada, New Mexico, North Carolina, Ohio, Oklahoma, Oregon, Rhode Island, South Carolina, South Dakota, Tennessee, Texas, Vermont, Virginia, Washington, West Virginia, and Wisconsin) reported no influenza activity.
--------------------------------------------------------------------------------
Report prepared May 24, 2007 Error processing SSI file