Pharmacokinetics
Pharmacokinetics (from Ancient Greek pharmakon "drug" and kinetikos "moving, putting in motion"; see chemical kinetics), sometimes abbreviated as PK, is a branch of pharmacology dedicated to determine the fate of substances administered to a living organism. The substances of interest include any chemical xenobiotic such as: pharmaceutical drugs, pesticides, food additives, cosmetics, etc. It attempts to analyze chemical metabolism and to discover the fate of a chemical from the moment that it is administered up to the point at which it is completely eliminated from the body. Pharmacokinetics is the study of how an organism affects a drug, whereas pharmacodynamics (PD) is the study of how the drug affects the organism. Both together influence dosing, benefit, and adverse effects, as seen in PK/PD models.
Overview
Pharmacokinetics describes how the body affects a specific xenobiotic/chemical after administration through the mechanisms of absorption and distribution, as well as the metabolic changes of the substance in the body (e.g. by metabolic enzymes such as cytochrome P450 or glucuronosyltransferase enzymes), and the effects and routes of excretion of the metabolites of the drug.[2] Pharmacokinetic properties of chemicals are affected by the route of administration and the dose of administered drug. These may affect the absorption rate.[3]
Models have been developed to simplify conceptualization of the many processes that take place in the interaction between an organism and a chemical substance. One of these, the multi-compartmental model, is the most commonly used approximations to reality; however, the complexity involved in adding parameters with that modelling approach means that monocompartmental models and above all two compartmental models are the most-frequently used. The various compartments that the model is divided into are commonly referred to as the ADME scheme (also referred to as LADME if liberation is included as a separate step from absorption):
- Liberation – the process of release of a drug from the pharmaceutical formulation.[4][5] See also IVIVC.
- Absorption – the process of a substance entering the blood circulation.
- Distribution – the dispersion or dissemination of substances throughout the fluids and tissues of the body.
- Metabolism (or biotransformation, or inactivation) – the recognition by the organism that a foreign substance is present and the irreversible transformation of parent compounds into daughter metabolites.
- Excretion – the removal of the substances from the body. In rare cases, some drugs irreversibly accumulate in body tissue.
The two phases of metabolism and excretion can also be grouped together under the title elimination. The study of these distinct phases involves the use and manipulation of basic concepts in order to understand the process dynamics. For this reason in order to fully comprehend the kinetics of a drug it is necessary to have detailed knowledge of a number of factors such as: the properties of the substances that act as excipients, the characteristics of the appropriate biological membranes and the way that substances can cross them, or the characteristics of the enzyme reactions that inactivate the drug.
All these concepts can be represented through mathematical formulas that have a corresponding graphical representation. The use of these models allows an understanding of the characteristics of a molecule, as well as how a particular drug will behave given information regarding some of its basic characteristics such as its acid dissociation constant (pKa), bioavailability and solubility, absorption capacity and distribution in the organism.
The model outputs for a drug can be used in industry (for example, in calculating bioequivalence when designing generic drugs) or in the clinical application of pharmacokinetic concepts. Clinical pharmacokinetics provides many performance guidelines for effective and efficient use of drugs for human-health professionals and in veterinary medicine.
Metrics
The following are the most commonly measured pharmacokinetic metrics:[6] The units of the dose in the table are expressed in moles (mol) and molar (M). To express the metrics of the table in units of mass, instead of Amount of substance, simply replace 'mol' with 'g' and 'M' with 'g/dm3'. Similarly, other units in the table may be expressed in units of an equivalent dimension by scaling.
| Characteristic | Description | Symbol | Unit | Formula | Worked example value |
|---|---|---|---|---|---|
| Dose | Amount of drug administered. | Design parameter | 500 mmol | ||
| Dosing interval | Time between drug dose administrations. | Design parameter | 24 h | ||
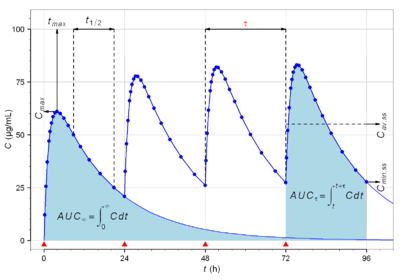
| Cmax | The peak plasma concentration of a drug after administration. | Direct measurement | 60.9 mmol/L | ||
| tmax | Time to reach Cmax. | Direct measurement | 3.9 h | ||
| Cmin | The lowest (trough) concentration that a drug
reaches before the next dose is administered. |
Direct measurement | 27.7 mmol/L | ||
| Volume of distribution | The apparent volume in which a drug is distributed
(i.e., the parameter relating drug concentration in plasma to drug amount in the body). |
6.0 L | |||
| Concentration | Amount of drug in a given volume of plasma. | 83.3 mmol/L | |||
| Elimination half-life | The time required for the concentration
of the drug to reach half of its original value. |
12 h | |||
| Elimination rate constant | The rate at which a drug is removed from the body. | 0.0578 h−1 | |||
| Infusion rate | Rate of infusion required to balance elimination. | 50 mmol/h | |||
| Area under the curve | The integral of the concentration-time curve
(after a single dose or in steady state). |
1,320 mmol/L·h | |||
| Clearance | The volume of plasma cleared of the drug per unit time. | 0.38 L/h | |||
| Bioavailability | The systemically available fraction of a drug. | Unitless | 0.8 | ||
| Fluctuation | Peak trough fluctuation within one dosing interval at steady state. |
where |
41.8% |


In pharmacokinetics, steady state refers to the situation where the overall intake of a drug is fairly in dynamic equilibrium with its elimination. In practice, it is generally considered that steady state is reached when a time of 4 to 5 times the half-life for a drug after regular dosing is started.
Pharmacokinetic models
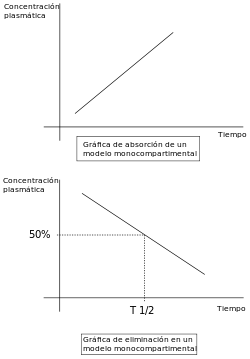
Pharmacokinetic modelling is performed by noncompartmental or compartmental methods. Noncompartmental methods estimate the exposure to a drug by estimating the area under the curve of a concentration-time graph. Compartmental methods estimate the concentration-time graph using kinetic models. Noncompartmental methods are often more versatile in that they do not assume any specific compartmental model and produce accurate results also acceptable for bioequivalence studies. The final outcome of the transformations that a drug undergoes in an organism and the rules that determine this fate depend on a number of interrelated factors. A number of functional models have been developed in order to simplify the study of pharmacokinetics. These models are based on a consideration of an organism as a number of related compartments. The simplest idea is to think of an organism as only one homogenous compartment. This monocompartmental model presupposes that blood plasma concentrations of the drug are a true reflection of the drug's concentration in other fluids or tissues and that the elimination of the drug is directly proportional to the drug's concentration in the organism (first order kinetics).
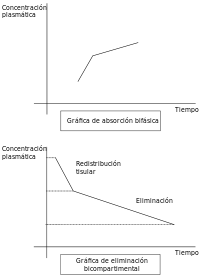
However, these models do not always truly reflect the real situation within an organism. For example, not all body tissues have the same blood supply, so the distribution of the drug will be slower in these tissues than in others with a better blood supply. In addition, there are some tissues (such as the brain tissue) that present a real barrier to the distribution of drugs, that can be breached with greater or lesser ease depending on the drug's characteristics. If these relative conditions for the different tissue types are considered along with the rate of elimination, the organism can be considered to be acting like two compartments: one that we can call the central compartment that has a more rapid distribution, comprising organs and systems with a well-developed blood supply; and a peripheral compartment made up of organs with a lower blood flow. Other tissues, such as the brain, can occupy a variable position depending on a drug's ability to cross the barrier that separates the organ from the blood supply.
This two compartment model will vary depending on which compartment elimination occurs in. The most common situation is that elimination occurs in the central compartment as the liver and kidneys are organs with a good blood supply. However, in some situations it may be that elimination occurs in the peripheral compartment or even in both. This can mean that there are three possible variations in the two compartment model, which still do not cover all possibilities.[8]
This model may not be applicable in situations where some of the enzymes responsible for metabolizing the drug become saturated, or where an active elimination mechanism is present that is independent of the drug's plasma concentration. In the real world each tissue will have its own distribution characteristics and none of them will be strictly linear. If we label the drug's volume of distribution within the organism VdF and its volume of distribution in a tissue VdT the former will be described by an equation that takes into account all the tissues that act in different ways, that is:

This represents the multi-compartment model with a number of curves that express complicated equations in order to obtain an overall curve. A number of computer programs have been developed to plot these equations.[8] However complicated and precise this model may be, it still does not truly represent reality despite the effort involved in obtaining various distribution values for a drug. This is because the concept of distribution volume is a relative concept that is not a true reflection of reality. The choice of model therefore comes down to deciding which one offers the lowest margin of error for the drug involved.
Noncompartmental analysis
Noncompartmental PK analysis is highly dependent on estimation of total drug exposure. Total drug exposure is most often estimated by area under the curve (AUC) methods, with the trapezoidal rule (numerical integration) the most common method. Due to the dependence on the length of x in the trapezoidal rule, the area estimation is highly dependent on the blood/plasma sampling schedule. That is, the closer time points are, the closer the trapezoids reflect the actual shape of the concentration-time curve. The number of time points available in order to perform a successful NCA analysis should be enough to cover the absorption, distribution and elimination phase to accurately characterize the drug. Beyond AUC exposure measures, parameters such as Cmax (maximum concentration), Tmax(time at maximum concentration), CL and Vd can also be reported using NCA methods.
Compartmental analysis
Compartmental PK analysis uses kinetic models to describe and predict the concentration-time curve. PK compartmental models are often similar to kinetic models used in other scientific disciplines such as chemical kinetics and thermodynamics. The advantage of compartmental over some noncompartmental analyses is the ability to predict the concentration at any time. The disadvantage is the difficulty in developing and validating the proper model. Compartment-free modelling based on curve stripping does not suffer this limitation. The simplest PK compartmental model is the one-compartmental PK model with IV bolus administration and first-order elimination. The most complex PK models (called PBPK models) rely on the use of physiological information to ease development and validation.
Single-compartment model
Linear pharmacokinetics is so-called because the graph of the relationship between the various factors involved (dose, blood plasma concentrations, elimination, etc.) gives a straight line or an approximation to one. For drugs to be effective they need to be able to move rapidly from blood plasma to other body fluids and tissues.
The change in concentration over time can be expressed as

Multi-compartmental models
The graph for the non-linear relationship between the various factors is represented by a curve; the relationships between the factors can then be found by calculating the dimensions of different areas under the curve. The models used in non-linear pharmacokinetics are largely based on Michaelis–Menten kinetics. A reaction's factors of non-linearity include the following:
- Multiphasic absorption: Drugs injected intravenously are removed from the plasma through two primary mechanisms: (1) Distribution to body tissues and (2) metabolism + excretion of the drugs. The resulting decrease of the drug's plasma concentration follows a biphasic pattern (see figure).
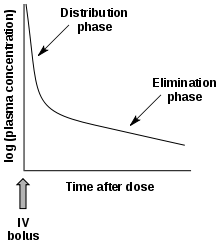 Plasma drug concentration vs time after an IV dose
- Alpha phase: An initial phase of rapid decrease in plasma concentration. The decrease is primarily attributed to drug distribution from the central compartment (circulation) into the peripheral compartments (body tissues). This phase ends when a pseudo-equilibrium of drug concentration is established between the central and peripheral compartments.
- Beta phase: A phase of gradual decrease in plasma concentration after the alpha phase. The decrease is primarily attributed to drug elimination, that is, metabolism and excretion.[9]
- Additional phases (gamma, delta, etc.) are sometimes seen.[10]
- A drug's characteristics make a clear distinction between tissues with high and low blood flow.
- Enzymatic saturation: When the dose of a drug whose elimination depends on biotransformation is increased above a certain threshold the enzymes responsible for its metabolism become saturated. The drug's plasma concentration will then increase disproportionately and its elimination will no longer be constant.
- Induction or enzymatic inhibition: Some drugs have the capacity to inhibit or stimulate their own metabolism, in negative or positive feedback reactions. As occurs with fluvoxamine, fluoxetine and phenytoin. As larger doses of these pharmaceuticals are administered the plasma concentrations of the unmetabolized drug increases and the elimination half-life increases. It is therefore necessary to adjust the dose or other treatment parameters when a high dosage is required.
- The kidneys can also establish active elimination mechanisms for some drugs, independent of plasma concentrations.
It can therefore be seen that non-linearity can occur because of reasons that affect the entire pharmacokinetic sequence: absorption, distribution, metabolism and elimination.
Variable volume in time models
Variable volume pharmacokinetic models can be drug centered models that imply a volume of drug distribution to be that volume in which the drug is distributed at that elapsed time following drug administration.[11][12] Another possibility occurs when the body volume is changing in time, which would occur, for example, during dialysis when the volume in which a drug can be distributed is itself changing in time.[13]
Bioavailability
At a practical level, a drug's bioavailability can be defined as the proportion of the drug that reaches its site of action. From this perspective the intravenous administration of a drug provides the greatest possible bioavailability, and this method is considered to yield a bioavailability of 1 (or 100%). Bioavailability of other delivery methods is compared with that of intravenous injection (absolute bioavailability) or to a standard value related to other delivery methods in a particular study (relative bioavailability).


Once a drug's bioavailability has been established it is possible to calculate the changes that need to be made to its dosage in order to reach the required blood plasma levels. Bioavailability is therefore a mathematical factor for each individual drug that influences the administered dose. It is possible to calculate the amount of a drug in the blood plasma that has a real potential to bring about its effect using the formula:

where De is the effective dose, B bioavailability and Da the administered dose.
Therefore, if a drug has a bioavailability of 0.8 (or 80%) and it is administered in a dose of 100 mg, the equation will demonstrate the following:
- De = 0.8 × 100 mg = 80 mg
That is the 100 mg administered represents a blood plasma concentration of 80 mg that has the capacity to have a pharmaceutical effect.
This concept depends on a series of factors inherent to each drug, such as:[14]
- Pharmaceutical form
- Chemical form
- Route of administration
- Stability
- Metabolism
These concepts, which are discussed in detail in their respective titled articles, can be mathematically quantified and integrated to obtain an overall mathematical equation:

where Q is the drug's purity.[14]

where is the drug's rate of administration and is the rate at which the absorbed drug reaches the circulatory system.

Finally, using the Henderson-Hasselbalch equation, and knowing the drug's (pH at which there is an equilibrium between its ionized and non ionized molecules), it is possible to calculate the non ionized concentration of the drug and therefore the concentration that will be subject to absorption:


When two drugs have the same bioavailability, they are said to be biological equivalents or bioequivalents. This concept of bioequivalence is important because it is currently used as a yardstick in the authorization of generic drugs in many countries.
LADME
A number of phases occur once the drug enters into contact with the organism, these are described using the acronym LADME:
- Liberation of the active substance from the delivery system,
- Absorption of the active substance by the organism,
- Distribution through the blood plasma and different body tissues,
- Metabolism that is inactivation of the xenobiotic substance, and finally
- Excretion or elimination of the substance or the products of its metabolism.
Some textbooks combine the first two phases as the drug is often administered in an active form, which means that there is no liberation phase. Others include a phase that combines distribution, metabolism and excretion into a disposition phase. Other authors include the drug's toxicological aspect in what is known as ADME-Tox or ADMET.
Each of the phases is subject to physico-chemical interactions between a drug and an organism, which can be expressed mathematically. Pharmacokinetics is therefore based on mathematical equations that allow the prediction of a drug's behavior and which place great emphasis on the relationships between drug plasma concentrations and the time elapsed since the drug's administration.
Analysis
Bioanalytical methods
Bioanalytical methods are necessary to construct a concentration-time profile. Chemical techniques are employed to measure the concentration of drugs in biological matrix, most often plasma. Proper bioanalytical methods should be selective and sensitive. For example, microscale thermophoresis can be used to quantify how the biological matrix/liquid affects the affinity of a drug to its target.[15][16]
Mass spectrometry
Pharmacokinetics is often studied using mass spectrometry because of the complex nature of the matrix (often plasma or urine) and the need for high sensitivity to observe concentrations after a low dose and a long time period. The most common instrumentation used in this application is LC-MS with a triple quadrupole mass spectrometer. Tandem mass spectrometry is usually employed for added specificity. Standard curves and internal standards are used for quantitation of usually a single pharmaceutical in the samples. The samples represent different time points as a pharmaceutical is administered and then metabolized or cleared from the body. Blank samples taken before administration are important in determining background and ensuring data integrity with such complex sample matrices. Much attention is paid to the linearity of the standard curve; however it is common to use curve fitting with more complex functions such as quadratics since the response of most mass spectrometers is not linear across large concentration ranges.[17][18][19]
There is currently considerable interest in the use of very high sensitivity mass spectrometry for microdosing studies, which are seen as a promising alternative to animal experimentation.[20]
Population pharmacokinetics
Population pharmacokinetics is the study of the sources and correlates of variability in drug concentrations among individuals who are the target patient population receiving clinically relevant doses of a drug of interest.[21][22][23] Certain patient demographic, pathophysiological, and therapeutical features, such as body weight, excretory and metabolic functions, and the presence of other therapies, can regularly alter dose-concentration relationships and can explain variability in exposures. For example, steady-state concentrations of drugs eliminated mostly by the kidney are usually greater in patients suffering from renal failure than they are in patients with normal renal function receiving the same drug dosage. Population pharmacokinetics seeks to identify the measurable pathophysiologic factors and explain sources of variability that cause changes in the dose-concentration relationship and the extent of these changes so that, if such changes are associated with clinically relevant and significant shifts in exposures that impact the therapeutic index, dosage can be appropriately modified. An advantage of population pharmacokinetic modelling is its ability to analyse sparse data sets (sometimes only one concentration measurement per patient is available).
Clinical pharmacokinetics
| Antiepileptic
medication |
Cardioactive
medication |
Immunosuppressor
medication |
Antibiotic
medication |
|---|---|---|---|
| Bronchodilator
medication |
Cytostatic
medication |
Antiviral
(HIV) medication |
Coagulation factors |
| + Efavirenz | |||
Clinical pharmacokinetics (arising from the clinical use of population pharmacokinetics) is the direct application to a therapeutic situation of knowledge regarding a drug's pharmacokinetics and the characteristics of a population that a patient belongs to (or can be ascribed to).
An example is the relaunch of the use of ciclosporin as an immunosuppressor to facilitate organ transplant. The drug's therapeutic properties were initially demonstrated, but it was almost never used after it was found to cause nephrotoxicity in a number of patients.[24] However, it was then realized that it was possible to individualize a patient's dose of ciclosporin by analysing the patients plasmatic concentrations (pharmacokinetic monitoring). This practice has allowed this drug to be used again and has facilitated a great number of organ transplants.
Clinical monitoring is usually carried out by determination of plasma concentrations as this data is usually the easiest to obtain and the most reliable. The main reasons for determining a drug's plasma concentration include:[25]
- Narrow therapeutic range (difference between toxic and therapeutic concentrations)
- High toxicity
- High risk to life.
Ecotoxicology
Ecotoxicology is the branch of science that deals with the nature, effects, and interactions of substances that are harmful to the environment.[26][27]
See also
|
References
- Nordberg M, Duffus J, Templeton DM (1 January 2004). "Glossary of terms used in toxicokinetics (IUPAC Recommendations 2003)". Pure and Applied Chemistry. 76 (5): 1033–1082. doi:10.1351/pac200476051033.
- Pharmacokinetics. (2006). In Mosby's Dictionary of Medicine, Nursing & Health Professions. Philadelphia, PA: Elsevier Health Sciences. Retrieved December 11, 2008, from http://www.credoreference.com/entry/6686418
- Knights K, Bryant B (2002). Pharmacology for Health Professionals. Amsterdam: Elsevier. ISBN 0-7295-3664-5.
- Koch HP, Ritschel WA (1986). "Liberation". Synopsis der Biopharmazie und Pharmakokinetik (in German). Landsberg, München: Ecomed. pp. 99–131. ISBN 3-609-64970-4.
- Ruiz-Garcia A, Bermejo M, Moss A, Casabo VG (February 2008). "Pharmacokinetics in drug discovery". Journal of Pharmaceutical Sciences. 97 (2): 654–90. doi:10.1002/jps.21009. PMID 17630642.
- AGAH working group PHARMACOKINETICS (2004-02-16). "Collection of terms, symbols, equations, and explanations of common pharmacokinetic and pharmacodynamic parameters and some statistical functions" (PDF). Arbeitsgemeinschaft für Angewandte Humanpharmakologie (AGAH) (Association for Applied Human Pharmacology). Retrieved 2011-04-04.
- Pharmacokinetics Online Resource University of Lausanne Faculty of Biology and Medicine (FBM)
- Milo Gibaldi, Donald Perrier. FarmacocinéticaReverté 1982 pages 1–10. ISBN 84-291-5535-X, 9788429155358
- Gill SC, Moon-Mcdermott L, Hunt TL, Deresinski S, Blaschke T, Sandhaus RA (Sep 1999). "Phase I Pharmacokinetics of Liposomal Amikacin (MiKasome) in Human Subjects: Dose Dependence and Urinary Clearance". Abstr Intersci Conf Antimicrob Agents Chemother. 39: 33 (abstract no. 1195).
- Weiner D, Gabrielsson J (2000). "PK24 – Non-linear kinetics – flow II". Pharmacokinetic/pharmacodynamic data analysis: concepts and applications. Apotekarsocieteten. pp. 527–36. ISBN 91-86274-92-9.
- Niazi S (March 1976). "Volume of distribution as a function of time". Journal of Pharmaceutical Sciences. 65 (3): 452–4. doi:10.1002/jps.2600650339. PMID 1263103.
- Wesolowski CA, Wesolowski MJ, Babyn PS, Wanasundara SN (2016). "Time Varying Apparent Volume of Distribution and Drug Half-Lives Following Intravenous Bolus Injections". PLOS ONE. 11 (7): e0158798. Bibcode:2016PLoSO..1158798W. doi:10.1371/journal.pone.0158798. PMC 4942076. PMID 27403663.
- Kim DK, Lee JC, Lee H, Joo KW, Oh KH, Kim YS, Yoon HJ, Kim HC (April 2016). "Calculation of the clearance requirements for the development of a hemodialysis-based wearable artificial kidney". Hemodialysis International. International Symposium on Home Hemodialysis. 20 (2): 226–34. doi:10.1111/hdi.12343. PMID 26245302.
- Michael E. Winter, Mary Anne Koda-Kimple, Lloyd Y. Young, Emilio Pol Yanguas Farmacocinética clínica básica Ediciones Díaz de Santos, 1994 pgs. 8–14 ISBN 84-7978-147-5, 9788479781477 (in Spanish)
- Baaske P, Wienken CJ, Reineck P, Duhr S, Braun D (March 2010). "Optical thermophoresis for quantifying the buffer dependence of aptamer binding". Angewandte Chemie. 49 (12): 2238–41. doi:10.1002/anie.200903998. PMID 20186894. Lay summary – Phsyorg.com.
- Wienken CJ, Baaske P, Rothbauer U, Braun D, Duhr S (October 2010). "Protein-binding assays in biological liquids using microscale thermophoresis". Nature Communications. 1 (7): 100. Bibcode:2010NatCo...1E.100W. doi:10.1038/ncomms1093. PMID 20981028.
- Hsieh Y, Korfmacher WA (June 2006). "Increasing speed and throughput when using HPLC-MS/MS systems for drug metabolism and pharmacokinetic screening". Current Drug Metabolism. 7 (5): 479–89. doi:10.2174/138920006777697963. PMID 16787157.
- Covey TR, Lee ED, Henion JD (October 1986). "High-speed liquid chromatography/tandem mass spectrometry for the determination of drugs in biological samples". Analytical Chemistry. 58 (12): 2453–60. doi:10.1021/ac00125a022. PMID 3789400.
- Covey TR, Crowther JB, Dewey EA, Henion JD (February 1985). "Thermospray liquid chromatography/mass spectrometry determination of drugs and their metabolites in biological fluids". Analytical Chemistry. 57 (2): 474–81. doi:10.1021/ac50001a036. PMID 3977076.
- Committee for Medicinal Products for Human Use (CHMP) (December 2009). "ICH guideline M3(R2) on non-clinical safety studies for the conduct of human clinical trials and marketing authorisation for pharmaceuticals" (PDF). European Medicines Agency, Evaluation of Medicines for Human Use. EMA/CPMP/ICH/286/1995. Retrieved 4 May 2013.
- Sheiner LB, Rosenberg B, Marathe VV (October 1977). "Estimation of population characteristics of pharmacokinetic parameters from routine clinical data". Journal of Pharmacokinetics and Biopharmaceutics. 5 (5): 445–79. doi:10.1007/BF01061728. PMID 925881.
- Sheiner LB, Beal S, Rosenberg B, Marathe VV (September 1979). "Forecasting individual pharmacokinetics". Clinical Pharmacology and Therapeutics. 26 (3): 294–305. doi:10.1002/cpt1979263294. PMID 466923.
- Bonate PL (October 2005). "Recommended reading in population pharmacokinetic pharmacodynamics". The AAPS Journal. 7 (2): E363–73. doi:10.1208/aapsj070237. PMC 2750974. PMID 16353916.
- O'Valle, F.; García del Moral, R.; Andujar, M. (1995). "Mecanismos de nefrotoxicidad por ciclosporina A a nivel celular". Nefrologia (in Spanish). 15 Supplement 1.
- Joaquín Herrera Carranza Manual de farmacia clínica y Atención Farmacéutica (in Spanish). Published by Elsevier España, 2003; page 159. ISBN 84-8174-658-4
- Jager T, Albert C, Preuss TG, Ashauer R (April 2011). "General unified threshold model of survival--a toxicokinetic-toxicodynamic framework for ecotoxicology". Environmental Science & Technology. 45 (7): 2529–40. Bibcode:2011EnST...45.2529J. doi:10.1021/es103092a. PMID 21366215.
- Ashauer R. "Toxicokinetic-Toxicodynamic Models – Ecotoxicology and Models". Swiss Federal Institute of Aquatic Science and Technology. Archived from the original on 2012-04-05. Retrieved 2011-12-03.
External links
Software
- Noncompartmental
- Freeware: bear and PK for R
- Commercial: MLAB, EquivTest, Kinetica, MATLAB/SimBiology, PKMP,Phoenix/WinNonlin, PK Solutions, RapidNCA.
- Compartment based
- Freeware: ADAPT, Boomer (GUI), SBPKPD.org (Systems Biology Driven Pharmacokinetics and Pharmacodynamics), WinSAAM, PKfit for R, PharmaCalc and PharmaCalcCL, Java applications.
- Commercial: Imalytics, Kinetica, MATLAB/SimBiology, Phoenix/WinNonlin, PK Solutions, PottersWheel, ProcessDB, SAAM II.
- Physiologically based
- Freeware: MCSim
- Commercial: acslX, Cloe PK, GastroPlus, MATLAB/SimBiology, PK-Sim, ProcessDB, Simcyp, Entelos PhysioLab Phoenix/WinNonlin, ADME Workbench.
- Population PK
- Freeware: WinBUGS, ADAPT, S-ADAPT / SADAPT-TRAN, Boomer, PKBugs, Pmetrics for R.
- Commercial: Kinetica, MATLAB/SimBiology, Monolix, NONMEM, Phoenix/NLME, PopKinetics for SAAM II, USC*PACK, DoseMe-Rx, Navigator Workbench.
- Simulation
All model based software above.
- Freeware: COPASI, Berkeley Madonna, MEGen.
Educational centres
Global centres with the highest profiles for providing in-depth training include the Universities of Buffalo, Florida, Gothenburg, Leiden, Otago, San Francisco, Beijing, Tokyo, Uppsala, Washington, Manchester, Monash University, and University of Sheffield.[1]
| Authority control |
|
|---|
- Tucker GT (June 2012). "Research priorities in pharmacokinetics". British Journal of Clinical Pharmacology. 73 (6): 924–6. doi:10.1111/j.1365-2125.2012.04238.x. PMC 3391520. PMID 22360418.