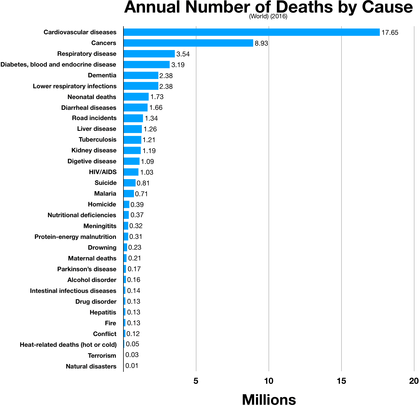
List of causes of death by rate
The following is a list of the causes of human deaths worldwide for the year 2002, arranged by their associated mortality rates. There were 57,029,000 deaths tabulated for that year. Some causes listed include deaths also included in more specific subordinate causes (as indicated by the "Group" column), and some causes are omitted, so the percentages do not sum to 100. According to the World Health Organization, about 58 million people died in 2005, using the International Statistical Classification of Diseases and Related Health Problems (ICD).[1] According to the Institute for Health Metrics and Evaluation, 52.77 million people died in 2010.[2]
The causes listed are relatively immediate medical causes, but the ultimate cause of death might be described differently. For example, tobacco smoking can cause lung disease or cancer, and alcohol abuse can cause liver failure or a motor vehicle accident. For statistics on preventable ultimate causes see Preventable causes of death.
By frequency
The table below uses data from 2002 and is out of date. Data is now available for 2015.[3]
Note: Tinted backgrounds indicate items that also appear in the subsequent table. Percentage figures add to more than 100% because some deaths appear in both broadly-defined and narrowly defined categories; for example, Cardiovascular Deaths includes deaths from both Ischaemic Heart Disease and Stroke.
| Group[5] | Cause | Percent of deaths | Deaths per 100,000 | |||
|---|---|---|---|---|---|---|
| Group | Subgroup | All | Male | Female | ||
| – | All causes | 100.0 | 100.0 | 916.1 | 954.7 | 877.1 |
| A | Cardiovascular diseases | 29.34 | 268.8 | 259.3 | 278.4 | |
| B | Infectious and parasitic diseases | 23.04 | 211.3 | 221.7 | 200.4 | |
| A.1 | Coronary artery disease | 12.64 | 115.8 | 121.4 | 110.1 | |
| C | Malignant neoplasms (cancers) | 12.49 | 114.4 | 126.9 | 101.7 | |
| A.2 | Cerebrovascular disease (stroke) | 9.66 | 88.5 | 85.4 | 95.6 | |
| B.1 | Respiratory infections | 6.95 | 63.7 | 63.5 | 63.8 | |
| B.1.1 | Lower respiratory tract infections | 6.81 | 62.4 | 62.2 | 62.6 | |
| D | Respiratory diseases | 6.49 | 59.5 | 61.1 | 57.9 | |
| E | Unintentional injuries | 6.23 | 57.0 | 73.7 | 40.2 | |
| B.2 | HIV/AIDS | 4.87 | 44.6 | 46.2 | 43.0 | |
| D.1 | Chronic obstructive pulmonary disease | 4.82 | 44.1 | 45.1 | 43.1 | |
| – | Perinatal conditions | 4.32 | 4.32 | 39.6 | 43.7 | 35.4 |
| F | Digestive diseases | 3.45 | 31.6 | 34.9 | 28.2 | |
| B.3 | Diarrhea diseases | 3.15 | 28.9 | 30.0 | 27.8 | |
| G | Intentional injuries (suicide, violence, war, etc.) | 2.84 | 26.0 | 37.0 | 14.9 | |
| B.4 | Tuberculosis | 2.75 | 25.2 | 32.9 | 17.3 | |
| B.5 | Malaria | 2.23 | 20.4 | 19.4 | 21.5 | |
| C.1 | Lung cancer | 2.18 | 20.0 | 28.4 | 11.4 | |
| E.1 | Road traffic accidents | 2.09 | 19.1 | 40.8 | 10.4 | |
| B.6 | Childhood diseases | 1.97 | 18.1 | 18.0 | 18.2 | |
| H | Neuropsychiatric disorders | 1.95 | 17.9 | 18.4 | 17.3 | |
| – | Diabetes mellitus | 1.73 | 1.73 | 15.9 | 14.1 | 17.7 |
| A.3 | Hypertensive heart disease | 1.60 | 14.6 | 13.4 | 15.9 | |
| G.1 | Suicide | 1.53 | 14.0 | 17.4 | 10.6 | |
| C.2 | Stomach cancer | 1.49 | 13.7 | 16.7 | 10.5 | |
| I | Diseases of the genitourinary system | 1.49 | 13.6 | 14.1 | 13.1 | |
| F.1 | Cirrhosis of the liver | 1.38 | 12.6 | 16.1 | 9.1 | |
| I.1 | Nephritis/nephropathy | 1.19 | 10.9 | 11.0 | 10.7 | |
| C.3 | Colorectal cancer | 1.09 | 10.0 | 10.3 | 9.7 | |
| C.4 | Liver cancer | 1.08 | 9.9 | 13.6 | 6.2 | |
| B.6.1 | Measles | 1.07 | 9.8 | 9.8 | 9.9 | |
| G.2 | Violence | 0.98 | 9.0 | 14.2 | 3.7 | |
| – | Maternal conditions | 0.89 | 0.89 | 8.2 | 0.0 | 16.5 |
| – | Congenital abnormalities | 0.86 | 0.86 | 7.9 | 8.1 | 7.7 |
| J | Nutritional deficiencies | 0.85 | 7.8 | 6.9 | 8.7 | |
| C.5 | Breast cancer | 0.84 | 7.7 | 0.1 | 15.3 | |
| C.6 | Esophageal cancer | 0.78 | 7.2 | 9.1 | 5.2 | |
| A.4 | Inflammatory heart disease | 0.71 | 6.5 | 6.7 | 6.2 | |
| H.1 | Alzheimer's disease and other dementias | 0.70 | 6.4 | 4.7 | 8.1 | |
| E.2 | Falls | 0.69 | 6.3 | 7.5 | 5.0 | |
| E.3 | Drowning | 0.67 | 6.1 | 8.4 | 3.9 | |
| E.4 | Poisoning | 0.61 | 5.6 | 7.2 | 4.0 | |
| C.7 | Lymphomas, multiple myeloma | 0.59 | 5.4 | 5.4 | 5.4 | |
| A.5 | Rheumatic heart disease | 0.57 | 5.3 | 4.4 | 6.1 | |
| C.8 | Oral and oropharynx cancers | 0.56 | 5.1 | 7.1 | 3.1 | |
| E.5 | Fires | 0.55 | 5.0 | 3.8 | 6.2 | |
| B.6.2 | Pertussis | 0.52 | 4.7 | 4.7 | 4.8 | |
| C.9 | Prostate cancer | 0.47 | 4.3 | 8.6 | 0.0 | |
| C.10 | Leukemia | 0.46 | 4.2 | 4.7 | 3.8 | |
| F.2 | Peptic ulcer disease | 0.46 | 4.2 | 5.0 | 3.5 | |
| J.1 | Protein-energy malnutrition | 0.46 | 4.2 | 4.2 | 4.2 | |
| – | Endocrine/nutritional disorders | 0.43 | 0.43 | 3.9 | 3.4 | 4.4 |
| D.2 | Asthma | 0.42 | 3.9 | 3.9 | 3.8 | |
| C.11 | Cervical cancer | 0.42 | 3.8 | 0.0 | 7.7 | |
| C.12 | Pancreatic cancer | 0.41 | 3.7 | 3.9 | 3.5 | |
| B.6.3 | Tetanus | 0.38 | 3.4 | 3.4 | 3.5 | |
| B.7 | Sexually transmitted diseases excluding HIV/AIDS | 0.32 | 2.9 | 2.9 | 2.9 | |
| C.13 | Bladder cancer | 0.31 | 2.9 | 4.0 | 1.7 | |
| B.8 | Meningitis | 0.30 | 2.8 | 2.9 | 2.7 | |
| G.3 | War | 0.30 | 2.8 | 5.0 | 0.5 | |
| B.7.1 | Syphilis | 0.28 | 2.5 | 2.7 | 2.3 | |
| – | Neoplasms other than malignant | 0.26 | 0.26 | 2.4 | 2.4 | 2.4 |
| J.2 | Iron deficiency anemia | 0.24 | 2.2 | 1.5 | 2.9 | |
| C.14 | Ovarian cancer | 0.24 | 2.2 | 0.0 | 4.4 | |
| B.9 | Tropical diseases excluding malaria | 0.23 | 2.1 | 2.5 | 1.6 | |
| H.2 | Epilepsy | 0.22 | 2.0 | 2.2 | 1.8 | |
| – | Musculoskeletal diseases | 0.19 | 0.19 | 1.7 | 1.2 | 2.2 |
| B.10 | Hepatitis B | 0.18 | 1.7 | 2.3 | 1.0 | |
| H.3 | Parkinson's disease | 0.17 | 1.6 | 1.6 | 1.6 | |
| H.4 | Alcohol use disorders | 0.16 | 1.5 | 2.5 | 0.4 | |
| H.5 | Drug use disorders | 0.15 | 1.4 | 2.2 | 0.5 | |
| B.1.2 | Upper respiratory infections | 0.13 | 1.2 | 1.2 | 1.2 | |
| C.15 | Uterine cancer | 0.12 | 1.1 | 0.0 | 2.3 | |
| – | Skin diseases | 0.12 | 0.12 | 1.1 | 0.8 | 1.4 |
| C.16 | Melanoma and other skin cancers | 0.12 | 1.1 | 1.1 | 1.0 | |
| B.11 | Hepatitis C | 0.09 | 0.9 | 1.1 | 0.6 | |
| B.9.1 | Leishmaniasis | 0.09 | 0.8 | 1.0 | 0.7 | |
| B.9.2 | Trypanosomiasis | 0.08 | 0.8 | 1.0 | 0.5 | |
| I.2 | Benign prostatic hyperplasia | 0.06 | 0.5 | 1.0 | 0.0 | |
Malnutrition
Malnutrition can be identified as an underlying cause for shortened life.[6] 70% of childhood deaths (age 0-4) are reportedly due to diarrheal illness, acute respiratory infection, malaria and immunizable disease. However 56% of these childhood deaths can be attributed to the effects of malnutrition as an underlying cause.[7] The effects of malnutrition include increased susceptibility to infection,[8] musculature wasting, skeletal deformities and neurologic development delays.[9] According to the World Health Organization, malnutrition is named as the biggest contributor to child mortality[10] with 36 million deaths in 2005 related to malnutrition.[11]
Developed vs. developing economies
Top causes of death, according to the World Health Organization report for the calendar year 2001:[12]
| Causes of death in developing countries | Number of deaths | Causes of death in developed countries | Number of deaths |
|---|---|---|---|
| HIV-AIDS | 2,678,000 | Ischaemic heart disease | 3,512,000 |
| Lower respiratory infections | 2,643,000 | Cerebrovascular disease | 3,346,000 |
| Ischaemic heart disease | 2,484,000 | Chronic obstructive pulmonary disease | 1,829,000 |
| Diarrhea | 1,793,000 | Lower respiratory infections | 1,180,000 |
| Cerebrovascular disease | 1,381,000 | Lung cancer | 938,000 |
| Childhood diseases | 1,217,000 | Car crash | 669,000 |
| Malaria | 1,103,000 | Stomach cancer | 657,000 |
| Tuberculosis | 1,021,000 | Hypertensive heart disease | 635,000 |
| Chronic obstructive pulmonary disease | 748,000 | Tuberculosis | 571,000 |
| Measles | 674,000 | Suicide | 499,000 |
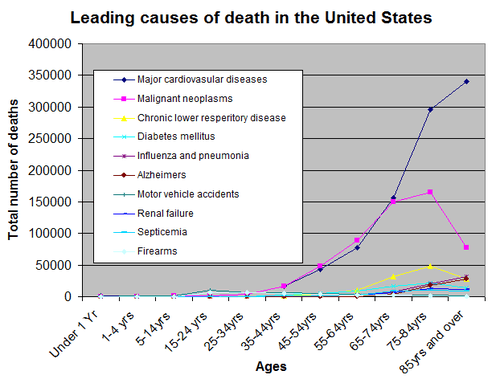
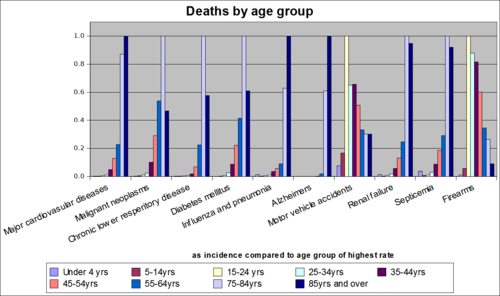
By age group
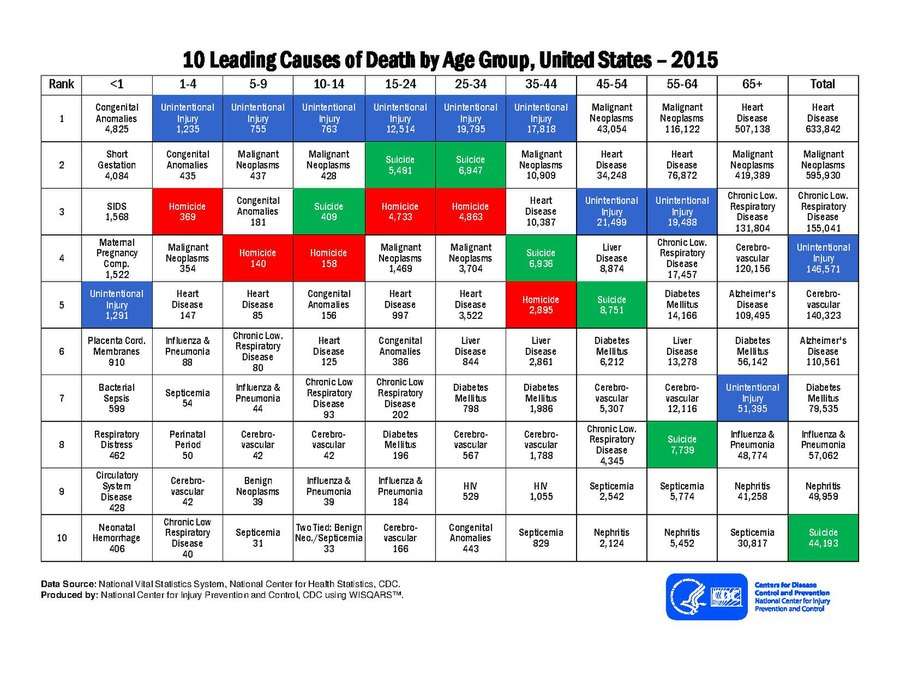
.png)
See also
- Capital punishment by country
- Epidemiology of suicide
- List of countries by intentional homicide rate
- List of killings by law enforcement officers by countries
- List of sovereign states and dependent territories by mortality rate
- List of terrorist incidents
- List of unusual deaths
- List of wars and anthropogenic disasters by death toll (with links to many by-country and by-type detail lists)
- Preventable causes of death
- Medical error
References
- WHO (2005). "Cancer".
- Lozano, Rafael; et al. (Dec 2012). "Global and regional mortality from 235 causes of death for 20 age groups in 1990 and 2010: a systematic analysis for the Global Burden of Disease Study 2010" (PDF). Lancet. 380 (9859): 2095–128. doi:10.1016/S0140-6736(12)61728-0. hdl:10536/DRO/DU:30050819. PMID 23245604.
- Wang, Haidong; et al. (2016). "Global, regional, and national life expectancy, all-cause mortality, and cause-specific mortality for 249 causes of death, 1980–2015: a systematic analysis for the Global Burden of Disease Study 2015". Lancet. 388 (10053): 1459–1544. doi:10.1016/S0140-6736(16)31012-1. PMC 5388903. PMID 27733281.
- World Health Organization (2004). "Annex Table 2: Deaths by cause, sex and mortality stratum in WHO regions, estimates for 2002" (PDF). The world health report 2004 - changing history. Retrieved 2008-11-01.
- Group is a value showing the relationship of groups of causes; for instance, statistics for "A" (cardiovascular diseases) include those for "A.1" (ischemic heart disease), "A.2" (cerebrovascular disease), and so on. If no value is shown for a cause, there are no other causes grouped with that cause.
- "Mortality In Second And Third Degree Malnutrition". Tropej.oxfordjournals.org. 2014-06-03. Retrieved 2014-06-09.
- Pelletier DL, Frongillo EA, Schroeder DG, Habicht JP (2014-01-24). "The effects of malnutrition on child mortality in developing countries". Bull. World Health Organ. 73 (4): 443–8. PMC 2486780. PMID 7554015.
- "Some effects of malnutrition on the immune response in man". Ajcn.nutrition.org. 1974-06-01. Retrieved 2014-06-09.
- "Elsevier". Pediatric.theclinics.com. Retrieved 2014-06-09.
- Stay informed today; every day (2008-01-24). "Malnutrition: The starvelings". The Economist. Retrieved 2014-06-09.
- Ziegler, Jean (2007). L'Empire de la honte. Fayard
- "Cause of Death". UC Atlas of Global Inequality. University of California, Santa Cruz. 18 February 2004. Archived from the original on 18 June 2014. Retrieved 2014-06-09.
- "leading_causes_of_death_by_age_group_2015" (PDF). : National Center for Injury Prevention and Control. 2015.
- "National Vital Statistics Report" (PDF). National Vital Statistics Report, Vol. 50, No. 15. September 16, 2002.
- Day, Ryan Knutson, Liz (21 May 2012). "Methodology: How We Calculated the Tower Industry Death Rate".
- "Bureau of Labor Statistics; National Census of Fatal Occupational Injuries in 2006" (PDF). Retrieved 2014-06-09.
External links
| In medicine |
| ||||
|---|---|---|---|---|---|
| Lists |
| ||||
| Mortality |
| ||||
| After death |
| ||||
| Paranormal |
| ||||
| Legal |
| ||||
| Fields |
| ||||
| Other |
| ||||
| |||||