Monitoring (medicine)
In medicine, monitoring is the observation of a disease, condition or one or several medical parameters over time.
.jpg)
It can be performed by continuously measuring certain parameters by using a medical monitor (for example, by continuously measuring vital signs by a bedside monitor), and/or by repeatedly performing medical tests (such as blood glucose monitoring with a glucose meter in people with diabetes mellitus).
Transmitting data from a monitor to a distant monitoring station is known as telemetry or biotelemetry.
Classification by target parameter
Monitoring can be classified by the target of interest, including:
- Cardiac monitoring, which generally refers to continuous electrocardiography with assessment of the patients condition relative to their cardiac rhythm. A small monitor worn by an ambulatory patient for this purpose is known as a Holter monitor. Cardiac monitoring can also involve cardiac output monitoring via an invasive Swan-Ganz catheter.
- Hemodynamic monitoring, which monitors the blood pressure and blood flow within the circulatory system. Blood pressure can be measured either invasively through an inserted blood pressure transducer assembly, or noninvasively with an inflatable blood pressure cuff.
- Respiratory monitoring, such as:
- Pulse oximetry which involves measurement of the saturated percentage of oxygen in the blood, referred to as SpO2, and measured by an infrared finger cuff
- Capnography, which involves CO2 measurements, referred to as EtCO2 or end-tidal carbon dioxide concentration. The respiratory rate monitored as such is called AWRR or airway respiratory rate)
- Respiratory rate monitoring through a thoracic transducer belt, an ECG channel or via capnography
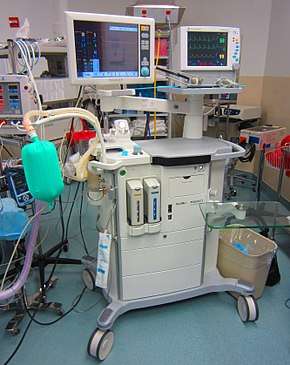
- Neurological monitoring, such as of intracranial pressure. Also, there are special patient monitors which incorporate the monitoring of brain waves (electroencephalography), gas anesthetic concentrations, bispectral index (BIS), etc. They are usually incorporated into anesthesia machines. In neurosurgery intensive care units, brain EEG monitors have a larger multichannel capability and can monitor other physiological events, as well.
- Blood glucose monitoring
- Childbirth monitoring
- Body temperature monitoring through an adhesive pad containing a thermoelectric transducer.
- Cancer therapy monitoring through circulating tumor cells[1]
Vital parameters

Monitoring of vital parameters can include several of the ones mentioned above, and most commonly include at least blood pressure and heart rate, and preferably also pulse oximetry and respiratory rate. Multimodal monitors that simultaneously measure and display the relevant vital parameters are commonly integrated into the bedside monitors in critical care units, and the anesthetic machines in operating rooms. These allow for continuous monitoring of a patient, with medical staff being continuously informed of the changes in general condition of a patient. Some monitors can even warn of pending fatal cardiac conditions before visible signs are noticeable to clinical staff, such as atrial fibrillation or premature ventricular contraction (PVC).
Medical monitor
A medical monitor or physiological monitor is a medical device used for monitoring. It can consist of one or more sensors, processing components, display devices (which are sometimes in themselves called "monitors"), as well as communication links for displaying or recording the results elsewhere through a monitoring network.
Components
Sensor
Sensors of medical monitors include biosensors and mechanical sensors.
Translating component
The translating component of medical monitors is responsible for converting the signals from the sensors to a format that can be shown on the display device or transferred to an external display or recording device.
Display device
Physiological data are displayed continuously on a CRT, LED or LCD screen as data channels along the time axis, They may be accompanied by numerical readouts of computed parameters on the original data, such as maximum, minimum and average values, pulse and respiratory frequencies, and so on.
Besides the tracings of physiological parameters along time (X axis), digital medical displays have automated numeric readouts of the peak and/or average parameters displayed on the screen.
Modern medical display devices commonly use digital signal processing (DSP), which has the advantages of miniaturization, portability, and multi-parameter displays that can track many different vital signs at once.
Old analog patient displays, in contrast, were based on oscilloscopes, and had one channel only, usually reserved for electrocardiographic monitoring (ECG). Therefore, medical monitors tended to be highly specialized. One monitor would track a patient's blood pressure, while another would measure pulse oximetry, another the ECG. Later analog models had a second or third channel displayed in the same screen, usually to monitor respiration movements and blood pressure. These machines were widely used and saved many lives, but they had several restrictions, including sensitivity to electrical interference, base level fluctuations and absence of numeric readouts and alarms.
Communication links
Several models of multi-parameter monitors are networkable, i.e., they can send their output to a central ICU monitoring station, where a single staff member can observe and respond to several bedside monitors simultaneously. Ambulatory telemetry can also be achieved by portable, battery-operated models which are carried by the patient and which transmit their data via a wireless data connection.
Digital monitoring has created the possibility, which is being fully developed, of integrating the physiological data from the patient monitoring networks into the emerging hospital electronic health record and digital charting systems, using appropriate health care standards which have been developed for this purpose by organizations such as IEEE and HL7. This newer method of charting patient data reduces the likelihood of human documentation error and will eventually reduce overall paper consumption. In addition, automated ECG interpretation incorporates diagnostic codes automatically into the charts. Medical monitor's embedded software can take care of the data coding according to these standards and send messages to the medical records application, which decodes them and incorporates the data into the adequate fields.
Long-distance connectivity can avail for telemedicine, which involves provision of clinical health care at a distance.
Other components
A medical monitor can also have the function to produce an alarm (such as using audible signals) to alert the staff when certain criteria are set, such as when some parameter exceeds of falls the level limits.
Mobile appliances
An entirely new scope is opened with mobile carried monitors, even such in sub-skin carriage. This class of monitors delivers information gathered in body-area networking (BAN) to e.g. smart phones and implemented autonomous agents.
Interpretation of monitored parameters
Monitoring of clinical parameters is primarily intended to detect changes (or absence of changes) in the clinical status of an individual. For example, the parameter of oxygen saturation is usually monitored to detect changes in respiratory capability of an individual.
Change in status versus test variability
When monitoring a clinical parameters, differences between test results (or values of a continuously monitored parameter after a time interval) can reflect either (or both) an actual change in the status of the condition or a test-retest variability of the test method.
In practice, the possibility that a difference is due to test-retest variability can almost certainly be excluded if the difference is larger than a predefined "critical difference". This "critical difference" (CD) is calculated as:[2]
, where:[2]
- K, is a factor dependent on the preferred probability level. Usually, it is set at 2.77, which reflects a 95% prediction interval, in which case there is less than 5% probability that a test result would become higher or lower than the critical difference by test-retest variability in the absence of other factors.
- CVa is the analytical variation
- CVi is the intra-individual variability
For example, if a patient has a hemoglobin level of 100 g/L, the analytical variation (CVa) is 1.8% and the intra-individual variability CVi is 2.2%, then the critical difference is 8.1 g/L. Thus, for changes of less than 8 g/L since a previous test, the possibility that the change is completely caused by test-retest variability may need to be considered in addition to considering effects of, for example, diseases or treatments.
| Sodium | 3% |
| Potassium | 14% |
| Chloride | 4% |
| Urea | 30% |
| Creatinine | 14% |
| Calcium | 5% |
| Albumin | 8% |
| Fasting glucose | 15% |
| Amylase | 30% |
| Carcinoembryonic antigen | 69% |
| C-reactive protein | 43%[3] |
| Glycosylated hemoglobin | 21% |
| Hemoglobin | 8% |
| Erythrocytes | 10% |
| Leukocytes | 32% |
| Platelets | 25% |
| Unless otherwise specified, then reference for critical values is Fraser 1989[2] | |
Critical differences for other tests include early morning urinary albumin concentration, with a critical difference of 40%.[2]
Techniques in development
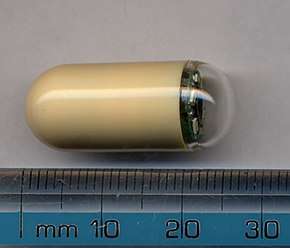
The development of new techniques for monitoring is an advanced and developing field in smart medicine, biomedical-aided integrative medicine, alternative medicine, self-tailored preventive medicine and predictive medicine that emphasizes monitoring of comprehensive medical data of patients, people at risk and healthy people using advanced, smart, minimally invasive biomedical devices, biosensors, lab-on-a-chip (in the future nanomedicine[4][5] devices like nanorobots) and advanced computerized medical diagnosis and early warning tools over a short clinical interview and drug prescription.
As biomedical research, nanotechnology and nutrigenomics advances, realizing the human body's self-healing capabilities and the growing awareness of the limitations of medical intervention by chemical drugs-only approach of old school medical treatment, new researches that shows the enormous damage medications can cause,[6][7] researchers are working to fulfill the need for a comprehensive further study and personal continuous clinical monitoring of health conditions while keeping legacy medical intervention as a last resort.
In many medical problems, drugs offer temporary relief of symptoms while the root of a medical problem remains unknown without enough data of all our biological systems[8] . Our body is equipped with sub-systems for the purpose of maintaining balance and self healing functions. Intervention without sufficient data might damage those healing sub systems.[8] Monitoring medicine fills the gap to prevent diagnosis errors and can assist in future medical research by analyzing all data of many patients.

Examples and applications
The development cycle in medicine is extremely long, up to 20 years, because of the need for U.S. Food and Drug Administration (FDA) approvals, therefore many of monitoring medicine solutions are not available today in conventional medicine.

- Blood glucose monitoring
- In vivo blood glucose monitoring devices can transmit data to a computer that can assist with daily life suggestions for lifestyle or nutrition and with the physician can make suggestions for further study in people who are at risk and help prevent diabetes mellitus type 2 .[9]
- Stress monitoring
- Bio sensors may provide warnings when stress levels signs are rising before human can notice it and provide alerts and suggestions.[10]
- Serotonin biosensor
- Future serotonin biosensors may assist with mood disorders and depression.[11]
- Continuous blood test based nutrition
- In the field of evidence-based nutrition, a lab-on-a-chip implant that can run 24/7 blood tests may provide a continuous results and a computer can provide nutrition suggestions or alerts.
- Psychiatrist-on-a-chip
- In clinical brain sciences drug delivery and in vivo Bio-MEMS based biosensors may assist with preventing and early treatment of mental disorders
- Epilepsy monitoring
- In epilepsy, next generations of long-term video-EEG monitoring may predict epileptic seizure and prevent them with changes of daily life activity like sleep, stress, nutrition and mood management.[12]
- Toxicity monitoring
- Smart biosensors may detect toxic materials such mercury and lead and provide alerts.[13]
See also
- Medical equipment
- Medical test
- Nanoelectromechanical system (NEMS)
- Functional medicine
References
- Pachmann, Katharina; Camara, Oumar; Kohlhase, Annika; Rabenstein, Carola; Kroll, Torsten; Runnebaum, Ingo B.; Hoeffken, Klaus (2010-08-08). "Assessing the efficacy of targeted therapy using circulating epithelial tumor cells (CETC): the example of SERM therapy monitoring as a unique tool to individualize therapy". Journal of Cancer Research and Clinical Oncology. 137 (5): 821–828. doi:10.1007/s00432-010-0942-4. ISSN 0171-5216. PMC 3074080. PMID 20694797.
- Fraser, C. G.; Fogarty, Y. (1989). "Interpreting laboratory results". BMJ (Clinical Research Ed.). 298 (6689): 1659–1660. doi:10.1136/bmj.298.6689.1659. PMC 1836738. PMID 2503170.
- C‐reactive protein (serum, plasma) from The Association for Clinical Biochemistry and Laboratory Medicine. Author: Brona Roberts. Copyrighted 2012
- "Healthcare 2030: disease-free life with home monitoring nanomedince". Positivefuturist.com.
- "Nanosensors for Medical Monitoring". Technologyreview.com.
- "Brain Damage Caused by Neuroleptic Psychiatric Drugs". Mindfreedom.org.
- "Medications That Can Cause Nerve Damage". Livestrong.com.
- Hyman, Mark (December 2008). The UltraMind Solution: Fix Your Broken Brain by Healing Your Body First. Scribner. ISBN 978-1-4165-4971-0.
- "Blood glucose testing and primary prevention of diabetes mellitus type 2 - evaluation of the effect of evidence based patient information". BMC Public health.
- ""Stress monitoring using a distributed wireless intelligent sensor system"". IEEE.
- "Using biosensors to detect the release of serotonin from taste buds during taste stimulation". Archives Italiennes de Biologie.
- Kamel JT, Christensen B, Odell MS, D'Souza WJ, Cook MJ (December 2010). "Evaluating the use of prolonged video-EEG monitoring to assess future seizure risk and fitness to drive". Epilepsy Behav. 19 (4): 608–11. doi:10.1016/j.yebeh.2010.09.026. PMID 21035403.
- Karasinski, Jason; Sadik, Omowunmi; Andreescu, Silvana (2006). "Multiarray Biosensors for Toxicity Monitoring and Bacterial Pathogens". Smart Biosensor Technology. Optical Science and Engineering. 20065381. CRC. pp. 521–538. doi:10.1201/9781420019506.ch19. ISBN 978-0-8493-3759-8.
Further reading
- Monitoring Level of Consciousness During Anesthesia & Sedation , Scott D. Kelley, M.D., ISBN 978-0-9740696-0-9
- Healthcare Sensor Networks: Challenges Toward Practical Implementation, Daniel Tze Huei Lai (Editor), Marimuthu Palaniswami (Editor), Rezaul Begg (Editor), ISBN 978-1-4398-2181-7
- Blood Pressure Monitoring in Cardiovascular Medicine and Therapeutics (Contemporary Cardiology), William B. White, ISBN 978-0-89603-840-0
- Physiological Monitoring and Instrument Diagnosis in Perinatal and Neonatal Medicine, Yves W. Brans, William W. Hay Jr, ISBN 978-0-521-41951-2
- Medical Nanotechnology and Nanomedicine (Perspectives in Nanotechnology), Harry F. Tibbals, ISBN 978-1-4398-0874-0
External links

- Personal Medical Monitoring Devices, The University of Maryland
- Advanced Patient Monitoring System, Healthcare Systems in India