Functional near-infrared spectroscopy
Functional near-infrared spectroscopy (fNIRS), is the use of near-infrared spectroscopy (NIRS) for the purpose of functional neuroimaging. Using fNIRS, brain activity is measured through hemodynamic responses associated with neuron behaviour. fNIRS is sensitive to the hemodynamic response to cerebral activation. This technology also has the ability to distinguish oxy- and deoxyhemoglobin changes.This device has been successfully implemented as a control signal for BCI systems.[1][2][3][4][5]
Description
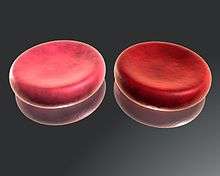
fNIRS is the absorption of near infrared light by hemoglobin. The light moves, or propagates, through the head and lends information about blood volume, flow and oxygenation. This technique is safe and non-invasive. It can be used in addition to other imaging modalities. fNIRS is most sensitive to scalp and skull. In order to have an increased sensitivity to the superficial cortex, there needs to be a larger source-detector ratio.
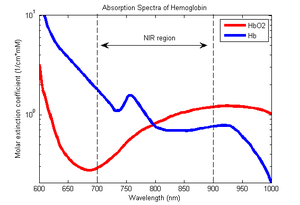
fNIRS is a non-invasive imaging method involving the quantification of chromophore concentration resolved from the measurement of near infrared (NIR) light attenuation or temporal or phasic changes. fNIRS spectrum light takes advantage of the optical window in which (a) skin, tissue, and bone are mostly transparent to NIR light (700–900 nm spectral interval) and (b) hemoglobin (Hb) and deoxygenated-hemoglobin (deoxy-Hb) are strong absorbers of light.These are the same principals behind pulse oximeters. There are four different ways that infrared light can interact with the brain tissue. Transmission, reflection, scattering, and absorption. Differences in the absorption spectra of deoxy-Hb and oxy-Hb allow the measurement of relative changes in hemoglobin concentration through the use of light attenuation at multiple wavelengths. Two or more wavelengths are selected, with one wavelength above and one below the isosbestic point of 810 nm at which deoxy-Hb and oxy-Hb have identical absorption coefficients. Using the modified Beer-Lambert law (mBLL), relative concentration can be calculated as a function of total photon path length. Typically the light emitter and detector are placed ipsilaterally (each emitter/detector pair on the same side) on the subject's skull so recorded measurements are due to back-scattered (reflected) light following elliptical pathways.
Comparing and contrasting other neuroimaging devices is an important thing to take into consideration. When comparing and contrasting these devices it is important to look at the temporal resolution, spatial resolution, and the degree of immobility. EEG (electroencephalograph) and MEG (magnetoencephalography) have high temporal resolution, but a low spatial resolution. EEG also has a higher degree of mobility than MEG has. When looking at fNIRS, they are similar to an EEG. They have a high degree of mobility as well as temporal resolution, and they have low spatial resolution. PET scans and fMRIs are grouped together, however they are distinctly different from the other neuroimaging scans. They have a high degree of immobility, medium/high spatial resolution, and a low temporal resolution. All of these neuroimaging scans have important characteristics and are valuable, however they have distinct characteristics. A special characteristic about fNIRS is that it is compatible with some of these modalities. The modalities include: MRI, EEG, and MEG.
Basic functional near infrared spectroscopy (fNIRS) abbreviations:
| BFi = blood flow index
DCS = diffuse correlation spectroscopy HbT= total hemoglobin concentration CW= continuous wave FD = frequency-domain HGB = blood hemoglobin CBV = cerebral blood volume TD=time-domain SaO2= arterial saturation CBF = cerebral blood flow HbO= oxygenated hemoglobin SvO2= venous saturation CMRO2= metabolic rate of oxygen HbR= deoxygenated hemoglobin SO2= hemoglobin saturation |
|---|
Functional imaging
The use of fNIRS as a functional imaging method relies on the principle of neuro-vascular coupling also known as the haemodynamic response or blood-oxygen-level dependent (BOLD) response. This principle also forms the core of fMRI techniques. Through neuro-vascular coupling, neuronal activity is linked to related changes in localized cerebral blood flow. fNIRS and fMRI are sensitive to similar physiologic changes and are often comparative methods. Studies relating fMRI and fNIRS show highly correlated results in cognitive tasks. fNIRS has several advantages in cost and portability over fMRI, but cannot be used to measure cortical activity more than 4 cm deep due to limitations in light emitter power and has more limited spatial resolution. fNIRS includes the use of diffuse optical tomography (DOT/NIRDOT) for functional purposes. Multiplexing fNIRS channels can allow 2D topographic functional maps of brain activity (e.g. with Hitachi ETG-4000, Artinis Oxymon, NIRx NIRScout, etc.) while using multiple emitter spacings may be used to build 3D tomographic maps.

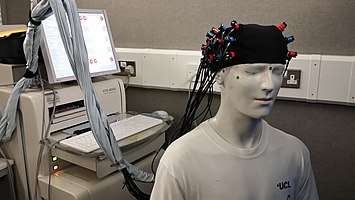
fNIRS Cap
fNIRS electrode locations and names are specified by the International 10–20 system. In addition to the standard positions of electrodes, short separation channels can be added. Short separation channels allow the measurement of scalp signals. Since the short separation channels measure the signal coming from the scalp, they allow the removal of the signal of superficial layers. This leaves behind the actual brain response. Short separation channel detectors are usually placed 8mm away from a source. They do not need to be in a specific direction or in the same direction as a detector.[6]
History
In 1977, Jöbsis[7] reported that brain tissue transparency to NIR light allowed a non-invasive and continuous method of tissue oxygen saturation using transillumination in neonates. Transillumination (forward-scattering) was of limited utility in adults because of light attenuation and was quickly replaced by reflectance-mode based techniques. Development of NIRS systems proceeded rapidly and by 1985, the first studies on cerebral oxygenation were conducted by M. Ferrari. In 1989, following work with David Delpy at University College London, Hamamatsu developed the first commercial NIRS system: NIR-1000 Cerebral Oxygenation Monitor. NIRS methods were initially used for cerebral oximetry in the 1990’s. In 1993, four publications by Chance et al PNAS, Hoshi & Tamura J Appl Physiol, Kato et al JCBFM, Villringer et al Neuros. Lett. demonstrated the feasibility of fNIRS in adult humans. NIRS techniques were further expanded on by the work of Randall Barbour, Britton Chance, Arno Villringer, M. Cope, D. T. Delpy, Enrico Gratton, and others. Currently, wearable fNIRS are being developed.
Spectroscopic techniques
There are four current modalities of fNIR Spectroscopy:
1. Continuous Wave
2. Frequency Domain
3. Time-Domain
4. Diffuse Correlation Spectroscopy
Continuous wave
Continuous wave (CW) fNIRS uses light sources which emit light at a constant frequency and amplitude. Changes in light intensity can be related to changes in relative concentrations of hemoglobin through the modified Beer–Lambert law (mBLL).[8] The Beer lambert-law has to deal with concentration of hemoglobin. CWNIRS stands for Continuous-Wave Near infrared spectroscopy. It is the least expensive and has more channels with a high temporal resolution. This technique also measures relative changes in light attenuation as well as using MBLL to quantify hemoglobin concentration changes. As far as things it cannot do, it does not distinguish between absorption and scattering changes and cannot measure absolute absorption values. It means that it is only sensitive to hemoglobin changes. However, the red light emitted from the fNIRS can travel tissues further without absorption.

Where is the optical density or attenuation, is emitted light intensity, is measured light intensity, is the attenuation coefficient, is the chromophomore concentration, is the distance between source and detector and is the differential path length factor, and is a geometric factor associated with scattering.


When the attenuation coefficients are known, constant scattering loss is assumed, and the measurements are treated differentially in time, the equation reduces to:

Where is the total corrected photon path-length.

Using a dual wavelength system, measurements for oxy-Hb (HbO2) and Deoxy-Hb(Hb) can be solved from the matrix equation:[9]

Due to their simplicity and cost-effectiveness, CW technologies are by far the most common form of functional NIRS. Measurement of absolute changes in concentration with the mBLL requires knowledge of photon path-length. Continuous wave methods do not have any knowledge of photon path-length and so changes in concentration are relative to an unknown path-length. Many CW-fNIRS commercial systems use estimations of photon path-length derived from computerized Monte-Carlo simulations and physical models to provide absolute quantification of hemoglobin concentrations.
Simplicity of principle allows CW devices to be rapidly developed for different applications such as neonatal care, patient monitoring systems, optical tomography systems, and more. Wireless CW systems have been developed, allowing monitoring of individuals in ambulatory, clinical and sports environments.[10][11][12]
Frequency Domain
In frequency domain (FD) systems, NIR laser sources provide an amplitude modulated sinusoid at frequencies near one hundred megahertz (100 MHz). FDNIRS measures attenuation, phase shift and the average path length of light through the tissue.Multi Distance, which is a part of the frequency domain NIRS, is insensitive to differences in skin color, the results are the same.
Changes in the back-scattered signal's amplitude and phase provide a direct measurement of absorption and scattering coefficients of the tissue, thus obviating the need for information about photon path-length; from the scattering and absorption coefficients the changes in the concentration of hemodynamic parameters are determined. Because of the need for modulated lasers as well as phasic measurements, frequency domain systems are more technically complex than continuous wave systems. However, these systems are capable of providing absolute concentrations of oxy-Hb and deoxy-Hb.
Time-Domain
In time-domain spectroscopy, a short NIR pulse is introduced with a pulse length usually on the order of picoseconds. Through time-of-flight measurements, photon path-length may be directly observed by dividing resolved time by the speed of light. Because of the need for high-speed detection and high-speed emitters, time-resolved methods are the most expensive and technically complicated method. Information about hemodynamic changes can be found in the attenuation, decay, and time profile of the back-scattered signal.Time-Domain NIRS is capable of photon counting technology, but is very expensive. It does have a slow sampling rate as well as a limited number of wavelengths. This device can count 1 photon for every 100 pulses to maintain linearity. The properties of this device are that it has higher depth sensitivity and baseline hemoglobin concentration and oxygenation.
Diffuse Correlation Spectroscopy
Diffuse correlation spectroscopy (DCS) systems use localized gradients in light attenuation to determine absolute ratios of oxy-Hb and deoxy-Hb. Using a spatial measurement, DCS systems do not require knowledge of photon path-length to make this calculation, however measured concentrations of oxy-Hb and deoxy-Hb are relative to the unknown coefficient of scattering in the media. This technique is most commonly used in cerebral oxymetry systems that report a Tissue Oxygenation Index (TOI) or Tissue Saturation Index (TSI).[13]
Data Analysis Software
HOMER3
HOMER3 allows users to obtain estimates and maps of brain activation. It is a set of matlab scripts used for analyzing fNIRS data. This set of scripts has evolved since the early 1990s first as the Photon Migration Imaging toolbox, then HOMER1 and HOMER2, and now HOMER3.[14]
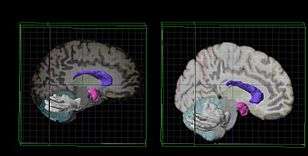
AtlasViewer
AtlasViewer allows fNIRS data to be visualized on a model of the brain. In addition, it also allows the user to design probes which can eventually be placed onto a subject.
Cerebral Oximetry Application
NIRS monitoring is helpful in a number of ways. Preterm infants can be monitored reducing cerebral hypoxia and hyperoxia. It is an effective aid in Cardiopulmonary bypass, is strongly considered to improve patient outcomes and reduce costs and extended stays. There are inconclusive results for use of NIRS with patients with traumatic brain injury, so it has been concluded that it should remain a research tool.
Future Direction
The advantages of fNIRS are that among other things it is non-invasive, some modalities are low cost, and they are all safe. Also as mentioned before, fNIRS has the capacity to have a high temporal resolution and be fully compatible with other imaging. One of the last advantages of fNIRS is that it has multiple hemodynamic biomarkers. Any system has its limitations, for fNIRS those include: low brain sensitivity, spatial resolution and penetration depth. Despite these limitations, the fNIRS device is relatively small and wearable. In the future, wireless fNIRS could allow neurophotonics to become portable. Applications for the fNIRS device are astounding which makes it easily accessible in many different scenarios. For example, this device has the potential to be used in a doctor's office, a global health situation, a natural environment, and it could be used as a health tracker. Finally, in the future, at risk individuals in a hospital could benefit from neuromonitoring and neurorehabilitation that fNIRS can offer.
See also
| Wikimedia Commons has media related to Near-infrared spectroscopy. |
- Near-infrared spectroscopy
- Diffuse optical tomography[16]
- Functional neuroimaging
- Cognitive neuroscience[17]
References
- Ayaz, H.; Shewokis, P. A.; Bunce, S.; Onaral, B. (2011). "An optical brain computer interface for environmental control". 2011 Annual International Conference of the IEEE Engineering in Medicine and Biology Society. Conference Proceedings : ... Annual International Conference of the IEEE Engineering in Medicine and Biology Society. IEEE Engineering in Medicine and Biology Society. Annual Conference. 2011. pp. 6327–30. doi:10.1109/IEMBS.2011.6091561. ISBN 978-1-4577-1589-1. PMID 22255785.
- Coyle, S. M.; Ward, T. S. E.; Markham, C. M. (2007). "Brain–computer interface using a simplified functional near-infrared spectroscopy system" (PDF). Journal of Neural Engineering. 4 (3): 219–226. doi:10.1088/1741-2560/4/3/007. PMID 17873424.
- Sitaram, R.; Zhang, H.; Guan, C.; Thulasidas, M.; Hoshi, Y.; Ishikawa, A.; Shimizu, K.; Birbaumer, N. (2007). "Temporal classification of multichannel near-infrared spectroscopy signals of motor imagery for developing a brain–computer interface". NeuroImage. 34 (4): 1416–1427. doi:10.1016/j.neuroimage.2006.11.005. PMID 17196832.
- Naseer N.; Hong M.J.; Hong K.-S. (2014). "Online binary decision decoding using functional near-infrared spectroscopy for the development of brain-computer interface". Experimental Brain Research. 232 (2): 555–564. doi:10.1007/s00221-013-3764-1. PMID 24258529.
- Naseer N.; Hong K.-S. (2013). "Classification of functional near-infrared spectroscopy signals corresponding to the right- and left-wrist motor imagery for development of a brain-computer interfaces". Neuroscience Letters. 553: 84–89. doi:10.1016/j.neulet.2013.08.021. PMID 23973334.
- Yücel, Meryem A.; Selb, Juliette; Aasted, Christopher M.; Petkov, Mike P.; Becerra, Lino; Borsook, David; Boas, David A. (July 2015). "Short separation regression improves statistical significance and better localizes the hemodynamic response obtained by near-infrared spectroscopy for tasks with differing autonomic responses". Neurophotonics. 2 (3): 035005. doi:10.1117/1.NPh.2.3.035005. ISSN 2329-423X. PMC 4717232. PMID 26835480.
- "Functional near-infrared spectroscopy", Wikipedia, 2019-11-26, retrieved 2019-11-26
- Villringer, A.; Chance, B. (1997). "Non-invasive optical spectroscopy and imaging of human brain function". Trends in Neurosciences. 20 (10): 435–442. doi:10.1016/S0166-2236(97)01132-6. PMID 9347608.
- Ayaz, H.; Shewokis, P. A.; Curtin, A.; Izzetoglu, M.; Izzetoglu, K.; Onaral, B. (2011). "Using MazeSuite and Functional Near Infrared Spectroscopy to Study Learning in Spatial Navigation". Journal of Visualized Experiments (56): 3443. doi:10.3791/3443. PMC 3227178. PMID 22005455.
- "Functional near-infrared spectroscopy", Wikipedia, 2019-11-26, retrieved 2019-11-26
- "Functional near-infrared spectroscopy", Wikipedia, 2019-11-26, retrieved 2019-11-26
- "Functional near-infrared spectroscopy", Wikipedia, 2019-11-26, retrieved 2019-11-26
- "Functional near-infrared spectroscopy", Wikipedia, 2019-11-26, retrieved 2019-11-26
- "HOMER2". HOMER2. Retrieved 2019-11-26.
- Aasted, Christopher M.; Yücel, Meryem A.; Cooper, Robert J.; Dubb, Jay; Tsuzuki, Daisuke; Becerra, Lino; Petkov, Mike P.; Borsook, David; Dan, Ippeita; Boas, David A. (April 2015). "Anatomical guidance for functional near-infrared spectroscopy: AtlasViewer tutorial". Neurophotonics. 2 (2). doi:10.1117/1.NPh.2.2.020801. ISSN 2329-423X. PMC 4478785. PMID 26157991.
- "NIRx | fNIRS Systems | NIRS Devices". NIRx Medical Technologies. Retrieved 2019-11-26.
- Yücel, Meryem A.; Selb, Juliette; Aasted, Christopher M.; Petkov, Mike P.; Becerra, Lino; Borsook, David; Boas, David A. (July 2015). "Short separation regression improves statistical significance and better localizes the hemodynamic response obtained by near-infrared spectroscopy for tasks with differing autonomic responses". Neurophotonics. 2 (3): 035005. doi:10.1117/1.NPh.2.3.035005. ISSN 2329-423X. PMC 4717232. PMID 26835480.
- "NIRS / fNIRS". Cortech Solutions, Inc. Retrieved 2019-11-26.
- "HOMER2". HOMER2. Retrieved 2019-11-26.
- Aasted, Christopher M.; Yücel, Meryem A.; Cooper, Robert J.; Dubb, Jay; Tsuzuki, Daisuke; Becerra, Lino; Petkov, Mike P.; Borsook, David; Dan, Ippeita; Boas, David A. (April 2015). "Anatomical guidance for functional near-infrared spectroscopy: AtlasViewer tutorial". Neurophotonics. 2 (2). doi:10.1117/1.NPh.2.2.020801. ISSN 2329-423X. PMC 4478785. PMID 26157991.