Doppler ultrasonography
Doppler ultrasonography is medical ultrasonography that employs the Doppler effect to generate imaging of the movement of tissues and body fluids (usually blood),[1] and their relative velocity to the probe. By calculating the frequency shift of a particular sample volume, for example, flow in an artery or a jet of blood flow over a heart valve, its speed and direction can be determined and visualized. Color Doppler or color flow Doppler is the presentation of the velocity by color scale. Color Doppler images are generally combined with grayscale (B-mode) images to display duplex ultrasonography images, allowing for simultaneous visualization of the anatomy of the area.
| Doppler ultrasonography, duplex ultrasonography | |
|---|---|
| Medical diagnostics | |
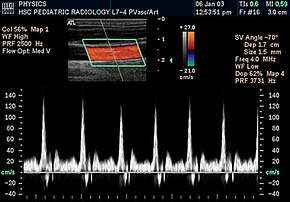 Spectral duplex scan of the common carotid artery | |
| MeSH | D018616 |
| MedlinePlus | 003433 |
This is particularly useful in cardiovascular studies (sonography of the vascular system and heart) and essential in many areas such as determining reverse blood flow in the liver vasculature in portal hypertension.
Operation
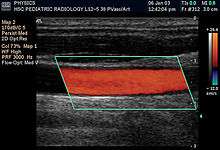
The Doppler data is displayed graphically using spectral Doppler, or as an image using color Doppler (directional Doppler) or power Doppler (non directional Doppler). This Doppler shift falls in the audible range and is often presented audibly using stereo speakers: this produces a very distinctive, although synthetic, pulsating sound.
All modern ultrasound scanners use pulsed Doppler to measure velocity. Pulsed wave instruments transmit and receive series of pulses. The frequency shift of each pulse is ignored, however the relative phase changes of the pulses are used to obtain the frequency shift (since frequency is the rate of change of phase). The major advantage of pulsed wave Doppler (PW Doppler) over continuous wave (CW Doppler) is that distance information is obtained (time between transmitted and received pulses multiplied by sound velocity equals distance) and gain correction is applied. The disadvantage of pulsed Doppler is that the measurements can suffer from aliasing. The terms Doppler ultrasound and Doppler sonography have been accepted to apply to both pulsed and continuous Doppler systems, despite the different mechanisms by which the velocity is measured.
There are no standards for displaying color Doppler. Some laboratories show arteries as red and veins as blue, as medical illustrators usually show them, even though some vessels may have portions flowing toward and portions flowing away from the transducer. This results in the illogical appearance of a vessel being partly a vein and partly an artery. Other laboratories use red to indicate flow toward the transducer and blue away from the transducer. Still other laboratories display the Doppler color map in accordance with published data, with red shift representing longer wavelengths (scattered) from blood flowing away from the transducer and blue representing the shorter wavelengths from blood flowing toward the transducer. Because of this confusion and lack of standards, the sonographer must understand the underlying physics of color Doppler and the physiology of normal and abnormal blood flow in the human body (see Red shift).[2][3][4]
Uses
Transcranial
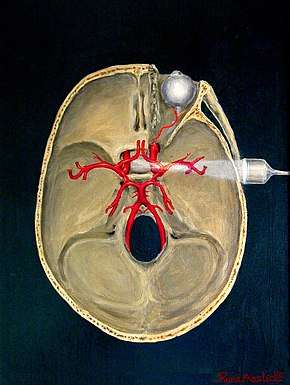
Transcranial Doppler (TCD) and transcranial color Doppler (TCCD) measure the velocity of blood flow through the brain's blood vessels transcranially (through the cranium). These modes of medical imaging conduct a spectral analysis of the acoustic signals they receive and can therefore be classified as methods of active acoustocerebrography. They are used as tests to help diagnose emboli, stenosis, vasospasm from a subarachnoid hemorrhage (bleeding from a ruptured aneurysm), and other problems. These relatively quick and inexpensive tests are growing in popularity. The tests are effective for detecting sickle cell disease, ischemic cerebrovascular disease, subarachnoid hemorrhage, arteriovenous malformations, and cerebral circulatory arrest. The tests are possibly useful for perioperative monitoring and meningeal infection.[5] The equipment used for these tests is becoming increasingly portable, making it possible for a clinician to travel to a hospital, to a doctor's office, or to a nursing home for both inpatient and outpatient studies. The tests are often used in conjunction with other tests such as MRI, MRA, carotid duplex ultrasound and CT scans. The tests are also used for research in cognitive neuroscience.
Blood vessels
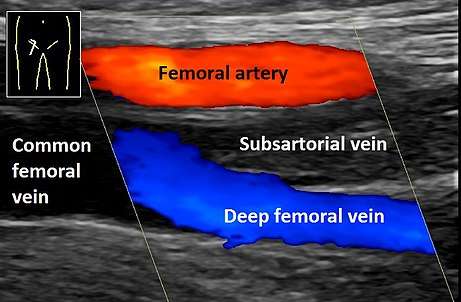
Vascular ultrasonography helps determine multiple factors within the circulatory system. It can evaluate central (abdominal) and peripheral arteries and veins, it helps determine the amount of vascular stenosis (narrowing) or occlusion (complete blockage) within an artery, it assists in ruling out aneurysmal disease, and it is the main aid to rule out thrombotic events. Duplex is an inexpensive, non-invasive way to determine pathology. It is used in for example:
- Carotid ultrasonography
- Ultrasonography of deep venous thrombosis
- Ultrasonography of chronic venous insufficiency of the legs
Duplex evaluation is usually done prior to any invasive testing or surgical procedure.[6] Ultrasound duplex scanning can provide additional information that may guide therapeutic decisions. The location and severity of arterial narrowings and occlusions can be identified. The vascular sonographer can map disease in lower-extremity segments with great accuracy, though duplex scanning is more time-consuming than other lower-extremity arterial studies.
An alternative to Doppler to visualize vessels is B-flow,[7] which digitally highlights weak flow reflectors (mainly red blood cells) while suppressing the signals from the surrounding stationary tissue. It can visualize flowing blood and surrounding stationary tissues simultaneously.[8]
In addition to visualization, ultrasound can also be used in doppler auscultation (without visual), similar to using an ultrasound baby monitor, to locate clots or other vascular obstructions or collapse by tracing a blood vessel until sound is no longer heard. [9] It is also used to conrfirm patency of Dorsalis Pedis arteries when edema or other conditions make manual palpation impractical.
Kidneys
%2C_diastolic_velocity_(Vd)%2C_acceleration_time_(AoAT)%2C_systolic_acceleration_(Ao_Accel)_and_resistive_index_(RI)_of_normal_kidney.jpg)
Doppler ultrasonography is widely used in renal ultrasonography. Renal vessels are easily depicted by the color Doppler technique in order to evaluate perfusion. Applying spectral Doppler to the renal artery and selected interlobular arteries, peak systolic velocities, resistive index, and acceleration curves can be estimated (Figure 4) (e.g., peak systolic velocity of the renal artery above 180 cm/s is a predictor of renal artery stenosis of more than 60%, and a resistive index, which is a calculated from peak systolic and end systolic velocity, above 0.70 is indicative of abnormal renovascular resistance).[10]
Heart
Doppler echocardiography is the use of Doppler ultrasonography to examine the heart.[11] An echocardiogram can, within certain limits, produce an accurate assessment of the direction of blood flow and the velocity of blood and cardiac tissue at any arbitrary point using the Doppler effect. One of the limitations is that the ultrasound beam should be as parallel to the blood flow as possible. Velocity measurements allow assessment of cardiac valve areas and function, any abnormal communications between the left and right side of the heart, any leaking of blood through the valves (valvular regurgitation), calculation of the cardiac output and calculation of E/A ratio[12] (a measure of diastolic dysfunction). Contrast-enhanced ultrasound using gas-filled microbubble contrast media can be used to improve velocity or other flow-related medical measurements.
Doppler fetal monitor
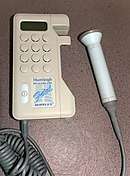
Doppler fetal monitors, although usually not technically -graphy but rather sound-generating, use the Doppler effect to detect the fetal heartbeat for prenatal care. These are hand-held, and some models also display the heart rate in beats per minute (BPM). Use of this monitor is sometimes known as Doppler auscultation. The Doppler fetal monitor is commonly referred to simply as a Doppler or fetal Doppler. Doppler fetal monitors provide information about the fetus similar to that provided by a fetal stethoscope.
Superficial soft tissues
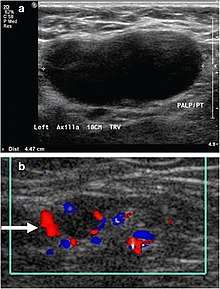
- Doppler ultrasonography that shows hyperaemic blood flow in the hilum and central cortex and/or abnormal (non-hilar cortical) blood flow
- Increased focal cortical thickness greater than 3 mm
- Absence of the fatty hilum
Doppler ultrasonography can help distinguishing benign from malignant soft tissue lumps.[13]
References
- Claude Franceschi (1978). L'Investigation vasculaire par ultrasonographie doppler. Masson. ISBN 2-225-63679-6.
- Ellis, George FR, Williams, Ruth M. (2000). Flat and Curved Space-Times (2nd ed.). Oxford University Press. ISBN 0-19-850656-2.CS1 maint: multiple names: authors list (link)
- DuBose, T. J.; Baker, A. L. (2009). "Confusion and Direction in Diagnostic Doppler Sonography". Journal of Diagnostic Medical Sonography. 25 (3): 173–7. doi:10.1177/8756479309335681.
- Terry J. DuBose. "Doppler Ultrasound History". Archived from the original on June 17, 2009. Retrieved January 25, 2008.
- "Transcranial Doppler: An Overview of its Clinical Applications". Archived from the original on April 25, 2015. Retrieved June 3, 2013.
- Robert A. Weiss; Craig Feied; Margaret A. Weiss (2001). Vein Diagnosis and Treatment: A Comprehensive Approach. McGraw-Hill Professional. ISBN 0-07-069201-7.
- Wachsberg, Ronald H. (2007). "B-Flow Imaging of the Hepatic Vasculature: Correlation with Color Doppler Sonography". American Journal of Roentgenology. 188 (6): W522–W533. doi:10.2214/AJR.06.1161. ISSN 0361-803X.
- Wang, Hsin-Kai; Chou, Yi-Hong; Chiou, Hong-Jen; Chiou, See-Ying; Chang, Cheng-Yen (2005). "B-flow Ultrasonography of Peripheral Vascular Diseases". Journal of Medical Ultrasound. 13 (4): 186–195. doi:10.1016/S0929-6441(09)60108-9. ISSN 0929-6441.
- Van Leeuwen, A.; Bladh, M. (2015). Davis’s Comprehensive Handbook of Laboratory & Diagnostic Tests with Nursing Implications, 6th ed. F.A. Davis Co.
- Content initially copied from: Hansen, Kristoffer; Nielsen, Michael; Ewertsen, Caroline (2015). "Ultrasonography of the Kidney: A Pictorial Review". Diagnostics. 6 (1): 2. doi:10.3390/diagnostics6010002. ISSN 2075-4418. PMC 4808817. (CC-BY 4.0)
- "Echocardiogram". MedlinePlus. Retrieved 2017-12-15.
- Abdul Latif Mohamed, Jun Yong, Jamil Masiyati, Lee Lim, Sze Chec Tee. "The Prevalence Of Diastolic Dysfunction In Patients With Hypertension Referred For Echocardiographic Assessment of Left Ventricular Function". Malaysian Journal of Medical Sciences, Vol. 11, No. 1, January 2004, pp. 66–74.
- Dialani, V.; James, D. F.; Slanetz, P. J. (2014). "A practical approach to imaging the axilla". Insights into Imaging. 6 (2): 217–229. doi:10.1007/s13244-014-0367-8. ISSN 1869-4101. PMC 4376818. Creative Commons attribution license