Classification of obesity
Obesity classification is a ranking of obesity, the medical condition in which excess body fat has accumulated to the extent that it has an adverse effect on health.[1] The World Health Organization (WHO) classifies obesity by body mass index (BMI). BMI is further evaluated in terms of fat distribution via the waist–hip ratio and total cardiovascular risk factors.[2][3] In children, a healthy weight varies with age and sex, and is obesity determination is in relation to a historical normal group.[4]
Background
Obesity is a medical condition in which excess body fat has accumulated to the extent that it has an adverse effect on health.[1] Relative weight and body mass index (BMI) are nearly identical and are reasonable estimates of body fatness as measured by percentage body fat.[5] However, BMI does not account for the wide variation in body fat distribution, and may not correspond to the same degree of fatness or associated health risk in different individuals and populations.[6][7][3] Other measurements of fat distribution include the waist–hip ratio and body fat percentage. Normal weight obesity is a condition of having normal body weight, but high body fat percentages with the same health risks of obesity.[8][9] BMI can be used to predict the risk of metabolic abnormalities like diabetes.[10]
Measurements
BMI
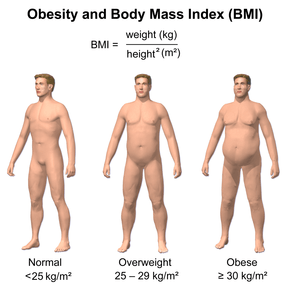
Body mass index or BMI is a simple and widely used method for estimating body fat mass.[11] BMI was developed in the 19th century by the Belgian statistician and anthropometrist Adolphe Quetelet.[12] BMI is an accurate reflection of body fat percentage in the majority of the adult population. However it is less accurate in people such as body builders and pregnant women.[13] A formula combining BMI, age, and gender can be used to estimate a person's body fat percentage to an accuracy of 4%.[14] An alternative method, body volume index (BVI) , is being developed by Mayo Clinic in an effort to better take into account different body shapes.[15] BVI measures body fat distribution and calculates the BVI number, based on these results. This BVI number is an indication of weight associated health risk.
| BMI | Classification[16] |
|---|---|
| < 18.5 | underweight |
| 18.5–24.9 | normal weight |
| 25.0–29.9 | overweight |
| 30.0–34.9 | class I obesity |
| 35.0–39.9 | class II obesity |
| ≥ 40.0 | class III obesity |
BMI is calculated by dividing the subject's mass by the square of his or her height, typically expressed either in metric or US "Customary" units:
- Metric:

- US/Customary and imperial:

The most commonly used definitions, established by the World Health Organization (WHO) in 1997 and published in 2000, provide the values listed in the table at right.[17]
Some modifications to the WHO definitions have been made by particular bodies. The surgical literature breaks down class III obesity into further categories, though the exact values are still disputed.[18]
- Any BMI ≥ 35 is severe obesity
- A BMI of ≥ 40 is morbid obesity
- A BMI of ≥ 50 is super obese
As Asian populations develop negative health consequences at a lower BMI than western populations, some nations have redefined obesity. The Japanese have defined obesity as any BMI greater than 25[19] while China uses a BMI of greater than 28.[20]
The BMI-based definition is easy to use and it is particularly convenient for statistical purposes, since it only depends on two commonly measured quantities, one's height and weight. However, it ignores variations between individuals in amounts of lean body mass, particularly muscle mass. Individuals involved in heavy physical labor or sports may have high BMI values despite having little fat. For example, more than half of all NFL players are classified as "obese" (BMI ≥ 30), and 1 in 4 are classified as "extremely obese" (BMI ≥ 35), according to the BMI metric.[21] However, their mean body fat percentage, 14%, is well within what's considered a healthy range.[22]
The preferred obesity metric in scholarly circles is the body fat percentage (BF%) - the ratio of the total weight of person's fat to his or her body weight, and BMI is viewed merely as a way to approximate BF%.[23] Levels in excess of 32% for women and 25% for men are generally considered to indicate obesity. However, accurate measurement of body fat percentage is much more difficult than measurement of BMI. Several methods of varying accuracy and complexity exist.
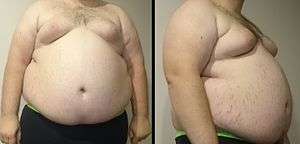
Other proposed but less common obesity measures include waist circumference and waist–hip ratio. These measure a common form of obesity known as abdominal or central obesity, characterized by excess deposits of fat in the abdominal region and inside peritoneal cavity. They have been shown to be comparable to BMI in their power to predict the risk of metabolic abnormalities such as type II diabetes,[24] and possibly superior to BMI as predictors of cardiovascular disease.[25]
Waist circumference and waist–hip ratio
In the United States a waist circumference of >102 cm (≈40") in men and >88 cm (≈34.5") in women[26] or the waist–hip ratio (the circumference of the waist divided by that of the hips of >0.9 for men and >0.85 for women) are used to define central obesity.[27]
In the European Union waist circumference of ≥ 94 cm(≈37") in men and ≥ 80 cm(≈31.5") in non pregnant women are used as cut offs for central obesity.[28]
A lower cut off of 90 cm has been recommended for South Asian and Chinese men, while a cut off of 85 cm has been recommended for Japanese men.[28]
In those with a BMI under 35, intra-abdominal body fat is related to negative health outcomes independent of total body fat.[29] Intra-abdominal or visceral fat has a particularly strong correlation with cardiovascular disease.[27] In a study of 15,000 people, waist circumference also correlated better with metabolic syndrome than BMI.[30] Women with abdominal obesity have a cardiovascular risk similar to that of men.[31] In people with a BMI over 35, measurement of waist circumference however adds little to the predictive power of BMI as most individuals with this BMI have abnormal waist circumferences.[32]
Body Volume Indicator
The Body Volume Indicator (BVI) is a novel method for calculating body fat distribution. Designed by Select Research and Mayo Clinic, BVI has been developed as an alternative to BMI.[33][34] BMI doesn't account for muscle and fat distribution, or gender, or ethnicity; and therefore is not an accurate measure of obesity in many individuals. BVI uses 3D technology to analyse overall body shape, identifying where fat is distributed across the body.[35]
Body Volume means the composition of a person and their body parts; each part of a person’s body (arms, legs, chest, etc.) has its own 3D shape, individual weight and measurement. An increase in the volume of fat and muscle normally corresponds with an increase or decrease of volume in that area of the body. BVI calculates a persons body fat composition from two images taken front and side on. A silhouette is extracted from these images and a 3D model created, from which detailed linear and volume measurements can be calculated. By comparing the 3D models to MRI data, BVI software is able to calculate fat distribution, and in particular visceral fat accumulated near the individual’s organs. The results will provide accurate measurements for waist to hip ratio, BMI, total body fat, visceral fat and BVI number.
The BVI Number has been designed by Mayo Clinic as an alternative to BMI. It provides an indication of health risk based on fat distribution with a particular emphasis on visceral fat; which is located around organs. Visceral fat is metabolically active, with high levels a known risk factor for cardiovascular disease[36] and diabetes type II.[37]
Body fat percentage
Body fat percentage is total body fat expressed as a percentage of total body weight. There is no generally accepted definition of obesity based on total body fat. Most researchers have used >25% in men, and >30% in women, as cut-points to define obesity.[38]
As by anthropometric methods, body fat percentage can be estimated from a person's BMI by the following formula:[39]

- where gender (sex) is 0 if female and 1 if male to account for the lower body fat percentage of men.
There are many other methods used to determine body fat percentage. Hydrostatic weighing, one of the most accurate methods of body fat calculation, involves weighing a person underwater. Two other simpler and less accurate methods have been used historically but are now not recommended.[40] The first is the skinfold test, in which a pinch of skin is precisely measured to determine the thickness of the subcutaneous fat layer.[41] The other is bioelectrical impedance analysis which uses electrical resistance. Bioelectrical impedance has not been shown to provide an advantage over BMI.[42]
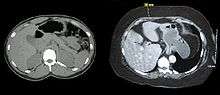
Body fat percentage measurement techniques used mainly for research include computed tomography (CT scan), magnetic resonance imaging (MRI), and dual energy X-ray absorptiometry (DEXA).[29] These techniques provide very accurate measurements, but it can be difficult to obtain in the severely obese due to weight limits of most equipment and insufficient diameter of many CT or MRI scanners.[43]
Childhood obesity
The healthy BMI range varies with the age and sex of the child. Obesity in children and adolescents is defined as a BMI greater than the 95th percentile.[44] The reference data that these percentiles are based on is from 1963 to 1994 and thus has not been affected by the recent increases in rates of obesity.[45]
Childhood obesity has reached epidemic proportions in 21st century with rising rates in both the developed and developing world. Rates of obesity in Canadian boys have increased from 11% in 1980s to over 30% in 1990s, while during this same time period rates increased from 4 to 14% in Brazilian children.[46]
As with obesity in adults many different factors contribute to the rising rates of childhood obesity. Changing diet and decreasing physical activity are believed to be the two most important in causing the recent increase in the rate of obesity. Activities from self-propelled transport, to school physical education, and organized sports has been declining in many countries.[47]
Because childhood obesity often persists into adulthood, and is associated with numerous chronic illnesses, it is important that children who are obese be tested for hypertension, diabetes, hyperlipidemia, and fatty liver.[48]
Treatments used in children are primarily lifestyle interventions and behavioral techniques. Medications are not FDA approved for use in this age group.[46]
See also
- Allometry
- Body adiposity index (BAI)
- Body fat percentage (BFP)
- Body mass index (BMI)
- Body mass index Prime (BMI Prime)
- Body Shape Index
- Body volume index
- Body water
- Corpulence index
- List of countries by Body Mass Index (BMI)
- Obesity paradox
- Pignet Index
- Sagittal Abdominal Diameter (SAD)
- Waist–hip ratio
- Waist-to-height ratio (also called waist-to-stature ratio (WSR))
References
- WHO 2000 p. 6
- Sweeting HN (October 2007). "Measurement and definitions of obesity in childhood and adolescence: a field guide for the uninitiated". Nutrition Journal. 6 (1): 32. doi:10.1186/1475-2891-6-32. PMC 2164947. PMID 17963490.
- NHLBI p.xiv
- "Healthy Weight: Assessing Your Weight: BMI: About BMI for Children and Teens". Center for disease control and prevention. Retrieved 6 April 2009.
- Gray DS, Fujioka K (1991). "Use of relative weight and Body Mass Index for the determination of adiposity". J Clin Epidemiol. 44 (6): 545–50. doi:10.1016/0895-4356(91)90218-X. PMID 2037859.
- WHO 2000, p. 7
- Sweeting HN (2007). "Measurement and Definitions of Obesity In Childhood and Adolescence: A field guide for the uninitiated". Nutr J. 6 (1): 32. doi:10.1186/1475-2891-6-32. PMC 2164947. PMID 17963490.
- Normal Weight Obesity: An Emerging Risk Factor for Heart and Metabolic Problems. Mayo Clinic. March 27, 2008.
- Katherine Zeratsky, R.D., L.D.. Normal weight obesity: A hidden health risk?: Can you be considered obese if you have a normal body weight? Mayo Clinic - Obesity Expert Answers. Aug. 5, 2009. Retrieved 2010-1-25.
- Vazquez, G.; Duval, S.; Jacobs, D. R.; Silventoinen, K. (2 May 2007). "Comparison of Body Mass Index, Waist Circumference, and Waist/Hip Ratio in Predicting Incident Diabetes: A Meta-Analysis". Epidemiologic Reviews. 29 (1): 115–128. doi:10.1093/epirev/mxm008. PMID 17494056.
- Mei Z, Grummer-Strawn LM, Pietrobelli A, Goulding A, Goran MI, Dietz WH (1 June 2002). "Validity of body mass index compared with other body-composition screening indexes for the assessment of body fatness in children and adolescents". Am J Clin Nutr. 75 (6): 978–85. doi:10.1093/ajcn/75.6.978. PMID 12036802.
- Quetelet LAJ (1871). Antropométrie ou Mesure des Différences Facultés de l'Homme. Brussels: Musquardt.
- NHLBI p.60
- Seidell 2005 p.3
- Romero-Corral, A. Somers, V. Lopez-Jimenez, F. Korenfeld, Y. Palin, S. Boelaert, K. Boarin, S. Sierra-Johnson, J. Rahim, A. (2008) 3-D Body Scanner, Body Volume Index: A Novel, Reproducible and Automated Anthropometric Tool Associated with Cardiometabolic Biomarkers Obesity A Research Journal 16 (1) 266-P
- "BMI classification". World Health Organization. Retrieved 15 February 2014.
- WHO 2000 p.9
- Sturm R (July 2007). "Increases in morbid obesity in the USA: 2000–2005". Public Health. 121 (7): 492–6. doi:10.1016/j.puhe.2007.01.006. PMC 2864630. PMID 17399752.
- Kanazawa M, Yoshiike N, Osaka T, Numba Y, Zimmet P, Inoue S (December 2002). "Criteria and classification of obesity in Japan and Asia-Oceania". Asia Pac J Clin Nutr. 11 Suppl 8: S732–S737. doi:10.1046/j.1440-6047.11.s8.19.x. PMID 12534701. Archived from the original on 2013-01-05.
- Bei-Fan Z; Cooperative Meta-Analysis Group of Working Group on Obesity in China (December 2002). "Predictive values of body mass index and waist circumference for risk factors of certain related diseases in Chinese adults: study on optimal cut-off points of body mass index and waist circumference in Chinese adults". Asia Pac J Clin Nutr. 11 Suppl 8: S685–93. doi:10.1046/j.1440-6047.11.s8.9.x. Archived from the original on 2013-01-05.
- "Many NFL Players Fatter Than Couch Potatoes".
- "NFL Players Not at Increased Heart Risk: Study finds they showed no more signs of cardiovascular trouble than general male population".
- Jacob C Seidell; Katherine M Flegal (1997). "Assessing obesity: classification and epidemiology" (PDF). British Medical Bulletin.
- Vazquez, G.; Duval, S.; Jacobs, D. R.; Silventoinen, K. (2007). "Comparison of Body Mass Index, Waist Circumference, and Waist/Hip Ratio in Predicting Incident Diabetes: A Meta-Analysis". Epidemiologic Reviews. 29: 115–128. doi:10.1093/epirev/mxm008.
- R Huxley; et al. (2010). "Body mass index, waist circumference and waist:hip ratio as predictors of cardiovascular risk—a review of the literature" (PDF). European Journal of Clinical Nutrition. 64 (1): 16–22. doi:10.1038/ejcn.2009.68. PMID 19654593. Archived from the original (PDF) on 2015-06-17. Retrieved 2012-03-21.
- Janssen I, Katzmarzyk PT, Ross R (October 2002). "Body mass index, waist circumference, and health risk: evidence in support of current National Institutes of Health guidelines". Arch. Intern. Med. 162 (18): 2074–9. doi:10.1001/archinte.162.18.2074. PMID 12374515.
- Yusuf S; Hawken S; Ounpuu S; Dans T; Avezum A; Lanas F; McQueen M; Budaj A; Pais P; Varigos J; Lisheng L; INTERHEART Study Investigators. (2004). "Effect of potentially modifiable risk factors associated with myocardial infarction in 52 countries (the INTERHEART study): Case-control study". Lancet. 364 (9438): 937–52. doi:10.1016/S0140-6736(04)17018-9. PMID 15364185.
- Tsigosa Constantine; Hainer, V; Basdevant, A; Finer, N; Fried, M; Mathus-Vliegen, E; Micic, D; Maislos, M; et al. (April 2008). "Management of Obesity in Adults: European Clinical Practice Guidelines". The European Journal of Obesity. 1 (2): 106–16. doi:10.1159/000126822. PMC 6452117. PMID 20054170.
- U.S. Preventive Services Task Force Evidence Syntheses (2000). HSTAT: Guide to Clinical Preventive Services, 3rd Edition: Recommendations and Systematic Evidence Reviews, Guide to Community Preventive Services.
- Janssen I, Katzmarzyk PT, Ross R (2004). "Waist circumference and not body mass index explains obesity-related health risk". Am. J. Clin. Nutr. 79 (3): 379–84. doi:10.1093/ajcn/79.3.379. PMID 14985210.
- Larsson B, Bengtsson C, Björntorp P, et al. (February 1992). "Is abdominal body fat distribution a major explanation for the sex difference in the incidence of myocardial infarction? The study of men born in 1913 and the study of women, Göteborg, Sweden". Am J Epidemiol. 135 (3): 266–73. doi:10.1093/oxfordjournals.aje.a116280. PMID 1546702.
- National Heart, Lung and Blood Institute. (1998). Morbidity and Mortality: 1998 Chartbook of Cardiovascular, Lung and Blood Diseases. Bethesda, MD: National Institutes of Health. P61
- "Week in Review: May 5". Insights. 2017-05-05. Retrieved 2019-05-07.
- "Archived copy". Archived from the original on 2018-06-20. Retrieved 2018-06-20.CS1 maint: archived copy as title (link)
- Abd Tahran. (2008) "Body volume index: time to replace body mass index?" Endocrine Abstracts 15 P104
- Van Gaal LF. (2006) "Mechanisms linking obesity with cardiovascular disease". Nature. 14;444(7121):875-80.
- Kahn SE et al. (2006) Mechanisms linking obesity to insulin resistance and type 2 diabetes. Nature. 2006 Dec 14;444(7121):840-6.
- Okorodudu; et al. (2010). "Diagnostic performance of body mass index to identify obesity as defined by body adiposity: a systematic review and meta-analysis". International Journal of Obesity. 34 (5): 791–799. doi:10.1038/ijo.2010.5. PMID 20125098.
- How to Convert BMI to Body Fat Percentage. By Jessica Bruso with reference to a study published in the International Journal of Obesity and Related Metabolic Disorders in 2002. July 18, 2017.
- NICE 2006 p.36
- Jebb and Wells 2005 p. 16.
- NICE 2006:36.
- Jebb and Wells 2005 p.20
- "Healthy Weight: Assessing Your Weight: BMI: About BMI for Children and Teens". Center for disease control and prevention. Retrieved April 6, 2009.
- Flegal KM, Ogden CL, Wei R, Kuczmarski RL, Johnson CL (June 2001). "Prevalence of overweight in US children: comparison of US growth charts from the Centers for Disease Control and Prevention with other reference values for body mass index". Am. J. Clin. Nutr. 73 (6): 1086–93. doi:10.1093/ajcn/73.6.1086. PMID 11382664.
- Flynn MA, McNeil DA, Maloff B, et al. (February 2006). "Reducing obesity and related chronic disease risk in children and youth: a synthesis of evidence with 'best practice' recommendations". Obes Rev. 7 Suppl 1: 7–66. doi:10.1111/j.1467-789X.2006.00242.x. PMID 16371076.
- Dollman J, Norton K, Norton L (December 2005). "Evidence for secular trends in children's physical activity behaviour". Br J Sports Med. 39 (12): 892–7, discussion 897. doi:10.1136/bjsm.2004.016675. PMC 1725088. PMID 16306494.
- Fennoy I (October 1, 2008). "Childhood Obesity, Part 1: Weight Evaluation and Comorbidity Screening". Consultant for Pediatricians.
- Bibliography
- National Heart, Lung, and Blood Institute (NHLBI) (1998). Clinical Guidelines on the Identification, Evaluation, and Treatment of Overweight and Obesity in Adults (PDF). International Medical Publishing, Inc. ISBN 978-1-58808-002-8.CS1 maint: multiple names: authors list (link)
- "Obesity: guidance on the prevention, identification, assessment and management of overweight and obesity in adults and children" (PDF). National Institute for Health and Clinical Excellence(NICE). National Health Services (NHS). 2006. Retrieved April 8, 2009.
- Puhl R., Henderson K., and Brownell K. Social consequences of obesity In:Peter G. Kopelman; Ian D. Caterson; Michael J. Stock; William H. Dietz (2005). Clinical obesity in adults and children: In Adults and Children. Blackwell Publishing. pp. 29–45. ISBN 978-1-4051-1672-5.
- Jebb S. and Wells J. Measuring body composition in adults and children In:Peter G. Kopelman; Ian D. Caterson; Michael J. Stock; William H. Dietz (2005). Clinical obesity in adults and children: In Adults and Children. Blackwell Publishing. pp. 12–28. ISBN 978-1-4051-1672-5.
- Kopelman P., Caterson I. An overview of obesity management In:Peter G. Kopelman; Ian D. Caterson; Michael J. Stock; William H. Dietz (2005). Clinical obesity in adults and children: In Adults and Children. Blackwell Publishing. pp. 319–326. ISBN 978-1-4051-1672-5.
- Seidell JC. Epidemiology — definition and classification of obesity In:Peter G. Kopelman; Ian D. Caterson; Michael J. Stock; William H. Dietz (2005). Clinical obesity in adults and children: In Adults and Children. Blackwell Publishing. pp. 3–11. ISBN 978-1-4051-1672-5.
- World Health Organization (WHO) (2000). Technical report series 894: Obesity: Preventing and managing the global epidemic (PDF). Geneva: World Health Organization. ISBN 978-92-4-120894-9. Archived from the original (PDF) on 2015-05-01. Retrieved 2009-10-21.