Basic reproduction number
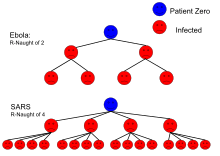
In epidemiology, the basic reproduction number (sometimes called basic reproductive ratio, or incorrectly basic reproductive rate, and denoted R0, r nought) of an infection can be thought of as the number of cases one case generates on average over the course of its infectious period, in an otherwise uninfected population.[6]
| Disease | Transmission | R0 |
|---|---|---|
| Measles | Airborne | 12–18 |
| Diphtheria | Saliva | 6-7 |
| Smallpox | Airborne droplet | 5–7 |
| Polio | Fecal-oral route | 5–7 |
| Rubella | Airborne droplet | 5–7 |
| Mumps | Airborne droplet | 4–7 |
| HIV/AIDS | Sexual contact | 2–5 |
| Pertussis | Airborne droplet | 5.5[2] |
| SARS | Airborne droplet | 2–5[3] |
| Influenza (1918 pandemic strain) | Airborne droplet | 2–3[4] |
| Ebola (2014 Ebola outbreak) | Bodily fluids | 1.5-2.5[5] |
This metric is useful because it helps determine whether or not an infectious disease can spread through a population. The roots of the basic reproduction concept can be traced through the work of Alfred Lotka, Ronald Ross, and others, but its first modern application in epidemiology was by George MacDonald in 1952, who constructed population models of the spread of malaria.
When
- R0 < 1
the infection will die out in the long run. But if
- R0 > 1
the infection will be able to spread in a population.
Generally, the larger the value of R0, the harder it is to control the epidemic. For simple models and a 100% effective vaccine, the proportion of the population that needs to be vaccinated to prevent sustained spread of the infection is given by 1 − 1/R0{{Citation needed}}. The basic reproduction number is affected by several factors including the duration of infectivity of affected patients, the infectiousness of the organism, and the number of susceptible people in the population that the affected patients are in contact with.
In populations that are not homogeneous, the definition of R0 is more subtle. The definition must account for the fact that a typical infected individual may not be an average individual. As an extreme example, consider a population in which a small portion of the individuals mix fully with one another while the remaining individuals are all isolated. A disease may be able to spread in the fully mixed portion even though a randomly selected individual would lead to fewer than one secondary case. This is because the typical infected individual is in the fully mixed portion and thus is able to successfully cause infections. In general, if the individuals who become infected early in an epidemic may be more (or less) likely to transmit than a randomly chosen individual late in the epidemic, then our computation of R0 must account for this tendency. An appropriate definition for R0 in this case is "the expected number of secondary cases produced by a typical infected individual early in an epidemic".[7]
Reproductive number as it relates to contact rate and infectious period
Say that an infectious individual makes β contacts per unit time producing new infections with a mean infectious period of 1/γ. Therefore, the basic reproduction number is
- R0 = β/γ
With varying latent periods
In cases of diseases with varying latent periods, the basic reproduction number can be calculated as the sum of the reproduction number for each transition time into the disease. An example of this is tuberculosis. Blower et al.[8] calculated from a simple model of TB the following reproduction number:
- R0 = R0FAST + R0SLOW
In their model, it is assumed that the infected individuals can develop active TB by either direct progression (the disease develops immediately after infection) considered above as FAST tuberculosis or endogenous reactivation (the disease develops years after the infection) considered above as SLOW tuberculosis.
Other uses
R0 is also used as a measure of individual reproductive success in population ecology,[9] evolutionary invasion analysis and life history theory. It represents the average number of offspring produced over the lifetime of an individual (under ideal conditions).
For simple population models, R0 can be calculated, provided an explicit decay rate (or "death rate") is given. In this case, the reciprocal of the decay rate (usually 1/d) gives the average lifetime of an individual. When multiplied by the average number of offspring per individual per timestep (the "birth rate" b), this gives R0 = b / d. For more complicated models that have variable growth rates (e.g. because of self-limitation or dependence on food densities), the maximum growth rate should be used.
Limitations of R0
When calculated from mathematical models, particularly ordinary differential equations, what is often claimed to be R0 is, in fact, simply a threshold, not the average number of secondary infections. There are many methods used to derive such a threshold from a mathematical model, but few of them always give the true value of R0. This is particularly problematic if there are intermediate vectors between hosts, such as malaria.[10]
What these thresholds will do is determine whether a disease will die out (if R0 < 1) or whether it may become epidemic (if R0 > 1), but they generally can not compare different diseases. Therefore, the values from the table above should be used with caution, especially if the values were calculated from mathematical models.
Methods include the survival function, rearranging the largest eigenvalue of the Jacobian matrix, the next-generation method,[11] calculations from the intrinsic growth rate,[12] existence of the endemic equilibrium, the number of susceptibles at the endemic equilibrium, the average age of infection [13] and the final size equation. Few of these methods agree with one another, even when starting with the same system of differential equations. Even fewer actually calculate the average number of secondary infections. Since R0 is rarely observed in the field and is usually calculated via a mathematical model, this severely limits its usefulness.[14]
In popular culture
In the 2011 film Contagion, a fictional medical disaster thriller, R0 calculations are presented to reflect the progression of a fatal viral infection from case studies to a pandemic.
In the TV series Travelers, R0 calculations are used to inform a group on the progression of a viral infection from various sources during a pandemic.
Further reading
- Jones, James Holland. "Notes on R0" (PDF). Retrieved 6 November 2018.
See also
- E-epidemiology
- Epi Info software program
- Epidemic model
- Epidemiological methods
- Epidemiological Transition
References
- Unless noted R0 values are from: History and Epidemiology of Global Smallpox Eradication Archived 2016-05-10 at the Wayback Machine From the training course titled "Smallpox: Disease, Prevention, and Intervention". The CDC and the World Health Organization. Slide 16-17.
- Kretzschmar M, Teunis PF, Pebody RG (2010). "Incidence and reproduction numbers of pertussis: estimates from serological and social contact data in five European countries". PLoS Med. 7 (6): e1000291. doi:10.1371/journal.pmed.1000291. PMC 2889930. PMID 20585374.
- Wallinga J, Teunis P (2004). "Different epidemic curves for severe acute respiratory syndrome reveal similar impacts of control measures". Am. J. Epidemiol. 160 (6): 509–16. doi:10.1093/aje/kwh255. PMID 15353409. Archived from the original on 2007-10-06.
- Mills CE; Robins JM; Lipsitch M (2004). "Transmissibility of 1918 pandemic influenza". Nature. 432 (7019): 904–6. Bibcode:2004Natur.432..904M. doi:10.1038/nature03063. PMID 15602562.
- Althaus, Christian L. (2014). "Estimating the Reproduction Number of Ebola Virus (EBOV) During the 2014 Outbreak in West Africa". PLoS Currents. 6. doi:10.1371/currents.outbreaks.91afb5e0f279e7f29e7056095255b288. PMC 4169395. PMID 25642364.
- Christophe Fraser; Christl A. Donnelly; Simon Cauchemez; et al. (19 June 2009). "Pandemic Potential of a Strain of Influenza A (H1N1): Early Findings". Science. 324 (5934): 1557–1561. Bibcode:2009Sci...324.1557F. doi:10.1126/science.1176062. PMC 3735127. PMID 19433588.Free text
- O Diekmann; J.A.P. Heesterbeek; J.A.J. Metz (1990). "On the definition and the computation of the basic reproduction ratio R0 in models for infectious diseases in heterogeneous populations". Journal of Mathematical Biology. 28 (4): 356–382. doi:10.1007/BF00178324. hdl:1874/8051. PMID 2117040.
- Blower, S. M., Mclean, A. R., Porco, T. C., Small, P. M., Hopewell, P. C., Sanchez, M. A., et al. (1995). "The intrinsic transmission dynamics of tuberculosis epidemics." Nature Medicine, 1, 815–821.
- de Boer; Rob J. Theoretical Biology (PDF). Retrieved 2007-11-13.
- Li J, Blakeley D, Smith? RJ (2011). "The Failure of R0". Computational and Mathematical Methods in Medicine. 2011 (527610): 1–17. doi:10.1155/2011/527610. PMC 3157160. PMID 21860658.
- Diekmann O, Heesterbeek JA (2000). Mathematical epidemiology of infectious diseases: model building, analysis and interpretation. New York: Wiley.
- Chowell G, Hengartnerb NW, Castillo-Chaveza C, Fenimorea PW, Hyman JM (2004). "The basic reproductive number of Ebola and the effects of public health measures: the cases of Congo and Uganda". Journal of Theoretical Biology. 229 (1): 119–126. arXiv:q-bio/0503006. doi:10.1016/j.jtbi.2004.03.006. PMID 15178190.
- Ajelli M; Iannelli M; Manfredi P & Ciofi degli Atti, ML (2008). "Basic mathematical models for the temporal dynamics of HAV in medium-endemicity Italian areas". Vaccine. 26 (13): 1697–1707. doi:10.1016/j.vaccine.2007.12.058. PMID 18314231.
- Heffernan JM, Smith RJ, Wahl LM (2005). "Perspectives on the Basic Reproductive Ratio". Journal of the Royal Society Interface. 2 (4): 281–93. doi:10.1098/rsif.2005.0042. PMC 1578275. PMID 16849186.
| General |
| ||||||
|---|---|---|---|---|---|---|---|
| Preventive healthcare | |||||||
| Population health |
| ||||||
| Biological and epidemiological statistics |
| ||||||
| Infectious and epidemic disease prevention | |||||||
| Food hygiene and safety management |
| ||||||
| Health behavioral sciences |
| ||||||
| Organizations, education and history |
| ||||||
| |||||||